Hi, Im Jenny Koob! I am a freshman at OWU, and I am planning on majoring in Environmental Science and Botany, with a potential minor in Geography! I’m fascinated by how our ecosystems work and learning more about climate change, as well as the impact humans have on our ecosystems. Aside from my major, I really enjoy being outdoors, traveling, listening to music, playing guitar, and spending a lot of time with my friends.

Schuurman ch. 1 reflection
Before reading this chapter, I didn’t have much idea about the details of GIS. I knew I would figure it out soon enough within this course, but to have it laid out in a chapter actually really helped me grasp it. All of the examples of the usefulness of GIS were already quite intriguing, but to learn that even Starbucks (my literal job) also uses it shocked me! There are so many careers that find GIS so helpful to their work, its actually pretty encouraging. The more I learn about it, the more it makes sense on how it is integrated into so many parts of our world.
It also discusses the statistical side of it, and what questions people have to ask from all angles to work with the computers correctly while getting the data they want out of it. Spatial analysis is considered a completely separate thing from mapping, which is interesting. The development of ESRI was also neat to read about, especially as an envs major. This part: “Although some human geographers claim that CIS is a direct descendant of the quantitative revolution, CIS researchers are loath to accept this simplistic genealogy.” was, again, so shocking to me. I had no idea about all the discourse and opposition geographers faced with the newfound tech. Even if GIS is revered by many, I didn’t expect it to be seen as something to not accept.
As the reading goes on, it talks about how we as people interpret and perceive information, and notes that a majority of scientists argue that people “reason” through imagery. Which is very true in our society; you can see this everywhere: from grocery stores putting imagery of foods and items for buyers to easily interpret, to our road signs, to the way we even learn the alphabet. As a society, we use visuals to absorb and learn information, and I think this is a really intriguing part to note. Plus, I like the topic of “fuzzy lines” because it shows how unrealistic it is to put everything in boundaries and lines (as much as it helps GIS). As the reading wraps up, the distinction between GISystems and GIScience is very confusing, honestly, and I hope I learn more about it.
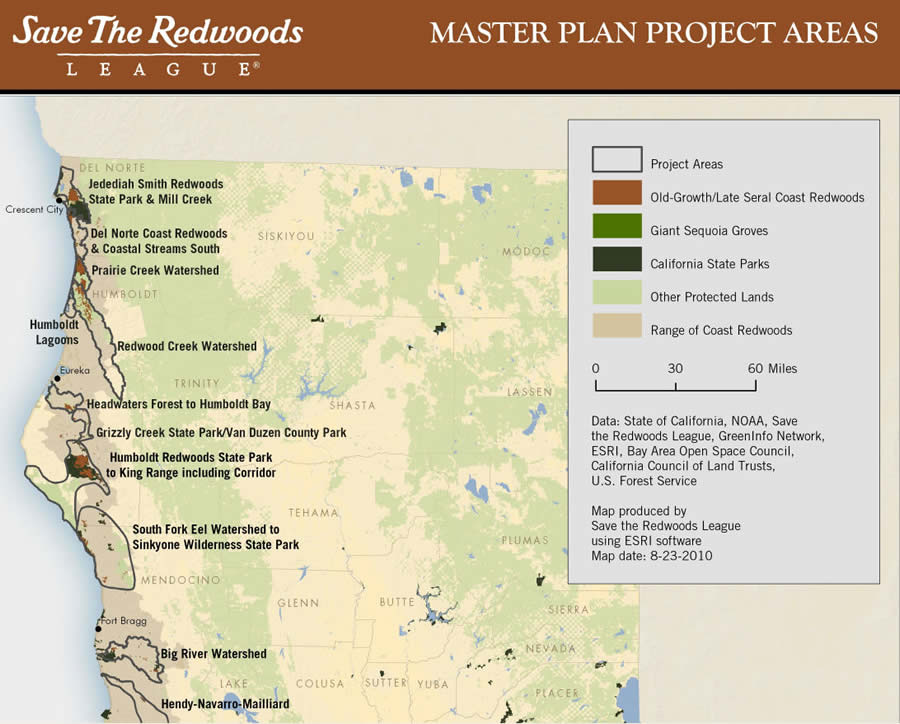
GIS applications– Coral reefs and the Redwoods
The first application I found with GIS was with the mapping of coral reefs. GIS helps scientists map, monitor, and analyze coral reef ecosystems by combining spatial data from satellites, drones, and field surveys to track changes over time. As climate change, warming ocean temperatures and ocean acidification continues, so does coral bleaching and habitat loss. GIS visualization shows spatial patterns of reef distribution and associated threats like thermal stress or human impacts.

The second application I was able to find was with California’s Redwoods.
GIS is used to map, monitor, and conserve redwood forests, especially along the California coast where the coast redwoods grow. By combining satellite imagery, elevation data, climate layers, and land-use information, GIS helps scientists understand where redwoods exist today, where they existed historically, and where they may survive in the future under climate change. I was actually lucky enough to have seen the Sequoia National Park last year, and hike through the forest of Redwoods. It was truly such an amazing experience, and I am very passionate about what I can do to help protect these trees.
I also completed Quiz 1! 🙂