Chapter 1
- ArcGIS- integrated collection of geographic information system software developed by Esri
- ArcGISPro- 64-bit desktop GIS application that uses a ribbon interface for 2D and 3D mapping
- Feature class- basic building block for displaying geographic features on a map
-
-
- Homogenous layer on map
- Vector data with corresponding attributes for each feature
-
- Raster dataset- major type of spatial data that is a picture made up of a bunch of pixels
- File geodatabase- with extension.gdb that stores feature classes, raster datasets, and other related files
- Project- file with extension.aprx that contains one or more maps and related items
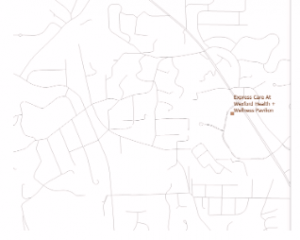
- Basemap helps orient users to location
- ex:
- ex:
- Catalog pane provides access to all components in ArcGIS project
- Can create map with heading through this
Tutorial 1-2
- Learned how to find attribute data for a feature
- Learned how to zoom in on feature
- Spatial bookmarks allow you to zoom to preset map views
- Can right click feature to get attribute table
Tutorial 1-3
- Can change order of attributes, names and displayed names of attributes, see data types, delete attributes, and make only certain attributes visible
- Learned more about how to navigate attribute table
Tutorial 1-4
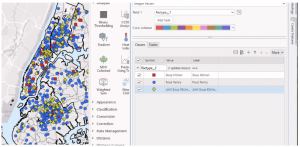
- Learning how to change symbols for feature classes (color, shape)
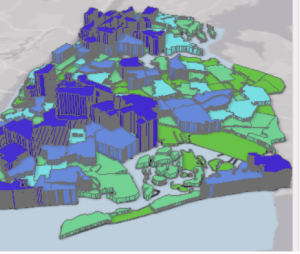
- Explored 3D maps
Chapter 2
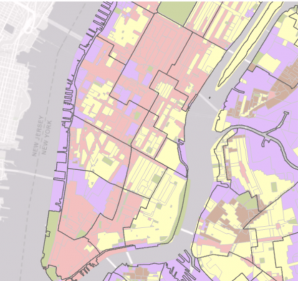
- Thematic map- consists of a subject layer/s (theme) placed in spatial context with other layers
- Make subject prominent while placing spatial context layers in the background
Tutorial 2-1
- Context layers often displayed using outlines with no color fill
- Water features exception- blue color, no outline
Tutorial 2-2
- Learning how to label all layers of map
- Learned how to filter out duplicate labels
Tutorial 2-3
- Use definition query to limit features to a desired subset of the larger collection based on values in feature attribute table
Tutorial 2-4
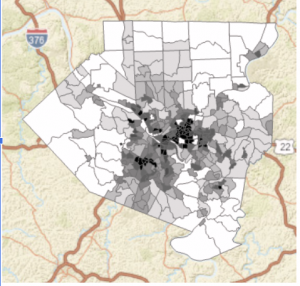
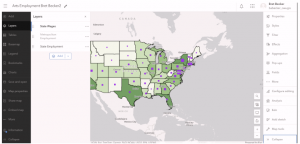
- Choropleth map- uses color in polygons to represent numeric attribute values
-
- Use classification methods to display data (default method is natural breaks)
- Uses algorithm to cluster values of numeric attributes into groups
-
- Use classification methods to display data (default method is natural breaks)
Tutorial 2-5
- Learning to display polygon data in their centers
Tutorial 2-6
- Choropleth map showing population useful for studying needs like demand for goods and services
- Choropleth maps of normalized data provide different data than choropleth maps of total population
- Normalized = segment of population divided by total population
- Density maps also form of normalized maps
- Can import and reuse symbology
Tutorial 2-7
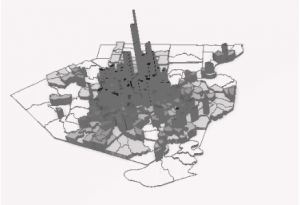
- Dot density maps can be used to denote quantitative values
- Display a total number randomly across a statistical unit
Tutorial 2-8
- Visibility ranges automatically turn layers and labeling on and off, depending on zoom
- Small scale- 1:50,000,000
- Large scale- 1:24,000
- Can turn a feature layer on or off using visibility ranges
Chapter 3
Tutorial 3-1
- Building map layout that has two maps
- Had some troubles here loading second map
- Learned how to add legends beside maps
- Because of struggles displaying the second map, I wasn’t able to follow the instruction for the create charts section
Tutorial 3-2
- Learning how to publish and share ArcGIS maps online
- Learning how to access our maps using ArcGIS Online
- I realized I have been signed into somebody else’s ArcGIS Pro this whole time…
Tutorial 3-3
- Learned how to create story on ArcGIS Online
- Added various headers, subheadings, paragraph texts, and maps

Tutorial 3-4
- Dashboards- visual displays of data feeds in an easy-to-understand format, usually with map as center of focus
- Learned how to create a dashboard
- Had issues filling screen with map, so I couldn’t finish the very last part