Hi, my name is Parker Tomlin, and I am a senior this year. I’m majoring in Exercise Science,

I did the quiz for GEO 291. While reading Chapter One of Schuurman’s text, I gained a deeper understanding of the history of Geographic Information Systems (GIS) and how they have evolved over time. I was especially intrigued by the wide range of applications GIS has today and the ongoing debates within the field of geography about its use and implications. Schuurman draws an important distinction between understanding how GIS is applied (GISystems) and the deeper theoretical understanding of how and why these systems work (GIScience). This differentiation helps frame the conversation around GIS not just as a tool, but as a field of study in itself. The origins of GIS date back to the 1960s, when Ian McHarg used spatial analysis to determine the best possible route for a highway. His work laid the foundation for computerized spatial analysis, which at the time was largely undervalued. However, pioneers like Harold McCarty and William Garrison began to recognize its potential, followed by Roger Tomlinson and Lee Pratt, who were instrumental in developing computerized cartography systems in Canada. These early contributions helped GIS become what it is today—a powerful and evolving field. As GIS has advanced, it has been categorized into two branches: GISystems, which focuses on the tools and technology, and GIScience, which explores the methods, ethics, and implications behind those tools. While GIS has practical applications in areas like agriculture, urban planning, and even e-commerce, GIScience plays a crucial role in ensuring these systems are accurate, ethical, and free from bias. It also raises important questions about who controls GIS data, how it is collected, and how it might impact individual privacy.
Application 1
For my first application, I wanted to look at grizzly bear populations and compare them to salmon populations in the same area.
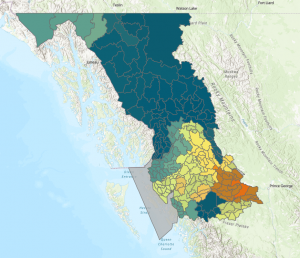
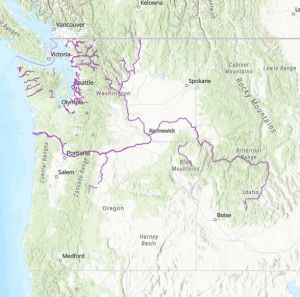
The yellow, orange, and red areas on the map indicate an area of concern for grizzly bear populations. The map of the salmon population made it easy to see that the areas where the grizzly bear population was healthy were also where the salmon population was the most dense.
Sources:
https://www.arcgis.com/apps/mapviewer/index.html?layers=856c6b542ede4815a14be63bd5e261cc
https://www.arcgis.com/apps/mapviewer/index.html?layers=fbe6f9687c90440a9aef0194c8f0f2e6