Hello, my name is Jocelyn Inderhees and I am a sophomore. I am majoring in zoology, pre-med, and environmental science with a minor in chemistry.

Through reading chapter one of the textbook, I realized the influence and how big GIS is compared to what I originally thought. Prior to this text I believed that GIS was more of a type of mapping software and now I am aware of the fact that it is more of a flexible spatial awareness software. GIS has many uses and that change depending on how it is used. The software can be used to help a business such as Starbucks to decide where to build the new locations for the best profit and what helps the business prosper based on location. It can also be used to help a city to figure out zoning ordnances or data for properties and many other uses. What took me by surprise the most was that GIS is not one fixed identity but many. It is more than a software it is a form of analysis and a science. GIS is very versatile for its uses. The history of GIS dates back to the 1960s. I found the story with the tracing paper and the highways to be very intriguing. How he used it to find the best route by layering the data and information to better make the decisions long before the technology of today came along. Eventually it was converted to be able to be done on computers like how we do so today which gave many more the ability to do spatial analysis and the advanced forms of GIS. Another thing that stood out was the difference between mapping and spatial analysis. Mapping is showing data in a visual way while spatial analysis or GIS goes deeper into analyzing the data and discovering the relationships. This shows why GIS is so useful in many different fields such as agriculture to developing a city and more. This chapter helped me to better understand GIS and that is far more than just a simple piece of software.
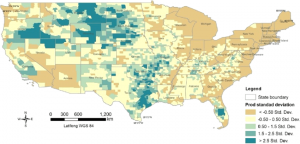
I find agriculture very interesting therefore I decided to research the distribution of cattle across the US. The map below shows there the cattle population is higher and lower. As shown the east coast and northern Midwest states have the lowest percentage while Great Plains regions have the highest concentration of population along with there being a decent amount in parts Texas, Oklahoma, and Missouri. You can tell where the agricultural parts of the country are, and the cattle populations reflect that. Overtime this map will change as more land becomes developed and less families have farms as the bigger companies are buying up the land and taking control of the agricultural businesses. The eastern states will overtime also lose more of their cattle while the Greater plains states will gain a higher percentage. The cattle production is clustered into certain parts. This helps with knowing what Agricultural policies to implement in different areas to help the cattle thrive and protect those in certain areas. Managing resources is also easier with this information.

Fig 1. shows the population of beef cattle density across the US.
Work Cited:
USDA’s Census of Agriculture, accessible via Ag Census Web Maps and downloadable county-level Excel files (NASS).
County-level figures for livestock inventory are updated every five years via the Census, with inter-census updates through “raking” to match state-level totals from agricultural surveys (NASS).
In 2022, total U.S. cattle inventory stood at ~88 million head (a 6.1% drop from 2017), with top beef cow inventory counties found in Nebraska, Nevada, and South Dakota; top cattle-on-feed counties in Texas, Kansas, California, and Nebraska (USDA NASS)