Hi! I’m Ethan McNichols, I’m a senior Environmental Studies major and double minor in Data & Society and Social Justice. I’m a member of OWU’s cross country and track teams, and on campus I’m involved with the TTRPG club (games like Dungeons and Dragons) and TCG club (like Magic the Gathering)
Prior to this course, I’ve had some amount of experience with GIS due to my summer internship at the Ohio EPA. I worked in the Stormwater program in the Department of Surface Water, and would use their internal GIS system primarily to locate permitted locations to conduct storm water inspections at. I also did some editing and correction of the dataset the software was operating off of, as there was a large batch of permits that had incorrect or missing location values. As the reading gets into GIS is an incredibly broad term and I’ve only had meaningful interaction with a very small part of that umbrella, so I’m excited to learn more throughout this class. I think its interesting that some GIS scholars view its conception as an inevitability, the natural conclusion to the converging technologies and disciplines of the time, especially as it relates to the documentation and interaction with population data like the census. I really enjoyed reading about the back and forth about GIS as the visualization of spatial patterns and the “intuitive” reasoning that it interacts with, as well as the distinction between GIS as science and as system as the field has grown and established itself.
A use of GIS technology that I find incredibly compelling is the website Queering the Map, where a community-generated database of personal moments and stories with the user’s queerness are mapped onto relevant locations. We’ve got a few of these data points on campus at the dorms and SLUs, and there are a few more scattered throughout Delaware. The project is a documentation of a spatial relationship to queerness, the places and communities that hold those experiences.
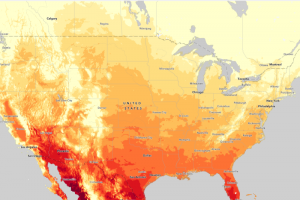
The other GIS system I looked at was GIS for Climate, a database maintained by ESRI which contains filters for flooding projections in the United States, days above 90 degrees Fahrenheit, and a lot of other climate change related spatial analysis.