- Hello! My name is Aiden Veerjee, Junior and I come from Johnstown Ohio. My major is in Quantitative Economics and I have a minor in Geography. I am in Alpha Sigma Phi, I am in the Economics & Business student board, and I am the Comptroller for WCSA (Student Government), I am also the President for our school’s Investment Club. I am also interested in Chess and Fencing, I’ve been doing a lot of reading & working out.
2. One of my professors for Economics had brought up that he had worked with a student who used GIS for a research project for modeling labor, but I had not fully realized that a lot of different disciplines had used GIS in various ways. I was especially surprised to the extent of sales that the GIS technology has achieved. I had only seen Geography mostly as the looking at political & land-maps, but not as much of the data within certain spaces & the specializing of resources / data. Before this chapter I was more unaware of the source of people using GIS systems, I had originally thought it was a more modern invention with the modernizing of computers, more internet access, and the general monetizing of data analysis. I had beenvery surprised to know that GIS had been used for a lot longer than just the twenty-first century. One of the biggest questions that I hope to answer by taking this class is how well can models actually reference or represent the different environments that it composes of. It is one thing to say that the Earth is 75% water, and another to say where that water is, what regions have access to the water, and how said water is being used. I hope that by taking the course it will help me understand methods with answering questions such as this one. I had known about how solid data can be interpreted in many different ways and different people can come to different conclusions even when the data remains the same. Even with the way that data is collected or classified can lead to loads of different issues, such as one example that the text cites with how that mountains & hills are determined. Drawing boundaries can also lead to some issues, and I would like to see how or if these issues can get rectified.
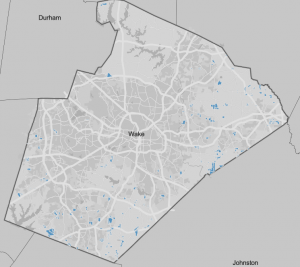
3. One topic that I have found interest in having to do with GIS is real estate. Real estate is a field that can take a lot of usage in collaboration with systems such as GIS. I had found some data on the agricultural districts within certain counties, I had wanted to see how close agriculture is to densely populated areas like cities and suburbs. I had thought before getting into the data that the agricultural districts would be further away from densely populated areas. Unsurprisingly, this had been reflected as true within Wake County NC. The blue within the image represents an agricultural district. I was surprised by some districts having a higher proximity to minor roads rather than big highways. Two different ways that this data can be used is to predict where good farmland might be for future farming. This can also be used as information for County taxation as since there is a very small amount of farmland, there may be less taxes & revenue gained through taxing agriculture.
Sources:
Wake County Map