me and my cat cletus!
Hey everyone! My name is Maizy Pratt- I’m a senior microbiology major with a minor in environmental science. I’m pretty spread out across campus- I’m a Theta, a member of the ENVS student board, working to start a microbiology club, and I work at Del-Co as the watershed intern. I’ve always been passionate about the outdoors, but I prefer the little organisms, so I’m pursuing a career in environmental microbiology. Outside of science time, I love listening to music, working out, being outside, learning new skills, painting/drawing, and thrifting.
I found this chapter incredibly interesting. I’ve always been aware that GIS exists and that it’s a tool able to be used across so many disciplines, but I guess I never really digested it to the point that this chapter did. John Snow’s visualization of Cholera outbreaks is something that gets talked about crazy often in microbiology classes because it was one of the first epidemiological investigations, but I never thought of it as an early development in GIS. I also enjoyed the discussion of precision farming; not only is it useful for farmers to save resources when solving problems, it’s also useful when studying the impact of farming practices on the surrounding environment. As part of watershed crew duties, we take nitrate samples from different parts of the Scioto to get a good idea of what levels will hit the treatment plant in the coming days, especially after big rains. I think it would be very interesting to compare runoff data and precision farming data to understand how the nitrates make their way into the river. It makes a lot of sense to me that GIS has developed in the way it did because humans are such visual creatures. Schuurman’s comparison to visualizing genomic data made my microbio brain very happy. I can absolutely see how GIS became so widespread as it allows for a better understanding of data that would make zero sense on the surface as just a set of numbers. Go GIS!
Search one: GIS+corn+diabetes

I was not given an article by the Google gods that talked about diabetes but I did find Atrazine exposure maps of Nebraska.
“Fig. 5. Exposure to Atrazine in Nebraska in 2005 (note: this is a population grid level map generated by the pesticide weighted exposure model developed in this study; exposure to Atrazine was categorized based on natural breaks; pixels with the value of 0 were distinguished from the first category 0–31.2).” (Wan 2015)
This paper explores the usage of pesticides, notably Atrazine, in different counties in Nebraska. Pesticide exposure has been shown to result in diseases such as cancer, neuro-degeneration, and reproductive issues. Wan used buffer-based exposure modeling to determine likelihood of exposure to Atrazine.
Search two: GIS+water+table
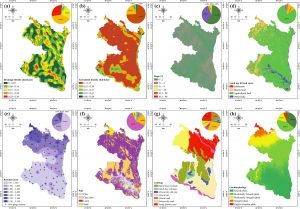
Here are some really cool maps of drainage density, lineament density, slope, land use and land cover, annual rainfall mean, soil, lithology, and geomorphology. RS-GI
S-based weighted overlay analysis and water-table-fluctuation technique were used to develop a potential map for groundwater abstraction in the northwest region of Bangladesh, which helps determine potential groundwater sources in the region. I didn’t realize how many variables go into determining groundwater availability and resources, so it was cool to learn about that.