Hi! My name is McKenna Tuttle. I am a junior on the softball team. I am a huge UK fan and have a cat named Zeke. I am an exercise science major and environmental science minor. I am from Richmond Kentucky. I’m the oldest of four girls and two of us have moved to Ohio since graduating high school. I plan on going into physical therapy after undergrad but the environment has been a big part of my life pretty much as long as I can remember.

This is my introduction to GIS. I have been impressed by the magnitude with which GIS can be used. I am particularly interested in how GIScientists and GISystems can tell us very specific information on how a community is being served and whether one neighborhood is treated the same as another. Before taking this class I did not even know that GIS existed, so it was shocking to realize how quickly GIS and spatial analysis has grown since its beginning in the late 1950s. Vancouver has dedicated over 135km of pavement to bike paths that have been determined with the help of GIS. The system also keeps bikers away from heavily trafficked areas and ensures they are safe. Seeing GIS as something that can be used so broadly is interesting to me. Using GPS to determine where the blight is on a wheat field and GIS can assist the farmers in determining where the best place for the next planting of crops is such a unique tool. In the text, it talks about how the GIS application is only as good as the data being put in. I also find that very interesting because there aren’t a lot of spaces where something so black and white can be skewed by false data. I would be very keen to do a study on what we could falsify using slightly incorrect data and GIS applications. It says that GIS has assisted urban planning. I am invested in walkable cities and city planning that are specifically designed for patrons to lower their emissions by walking/biking. I’m curious if GIS would be able to determine areas of a city that could be renovated into walkable areas only. If the information given to the system about traffic and jobs and living conditions was accurate I would see no reason that would not be available.
The first thing I looked into was GIS applications for LGBTQ+ youth resources because I know that it can be difficult for kids and teens to find help in some parts of the country and world. I asked ChatGPT to help me get familiarized with GIS and how exactly to research the topic on Google. Once on Google, I found a couple of maps with resources, but they were only in big cities like LA and New York. I had a hard time finding a nationwide map of resources. I would like to know if there is a disparity as we move into the Midwest and Bible Belt.
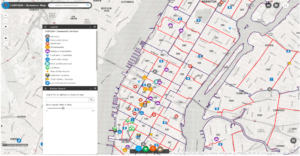
https://www.esri.com/about/newsroom/blog/nypd-pride-lgbtqia-resources/
Next, I looked at the Appalachian Mountains and coal mining. I’m from Kentucky and obviously, coal mining is a very divisive topic there. I found some interesting maps of counties that were most affected. I think the most interesting thing I found was a timelapse of mountaintop removal from 1984 to 2022 from an aerial satellite view. Below I left a link that will take you directly to that. I am also interested in looking at the GIS application of maybe where the mountaintop removal is taking place and where jobs are in Eastern Kentucky/West Virginia.
http://appvoices.org/end-mountaintop-removal/before-after/#%20