Hello! My name is Lily Bechina. I’m a sophomore environmental studies major. I play on the volleyball team here. I’m from Chicago. I don’t know exactly what I want to do yet but definitely something in the environmental studies field.
Reading through the short introduction, I found it interesting how geographers would dispute the value of GIS. I just didn’t quite understand how it could be bad. Of course, as I read on, I began to understand how using GIS takes away from other research methods that possibly require more and/or different skill sets.
The story about where GIS comes from (1962 McHarg) really helped me put into perspective what the basis of spatial analysis is and what purposes it serves. Visualizing a physical map on top of map on top of map helped me comprehend the fundamentals of GIS. Something else that helped my understanding was the calculator comparison. GIS is only useful to users if you understand how and why it works.
Reading about how GIS is based on two digits that are combined and composed to represent different things, I was reminded of work I did in high school engineering with interpreting and creating binary systems. I hope that this previous knowledge will help me in this course.
Something I hadn’t considered is how GIS is only useful in collaboration with humans. Unlike much modern technology, GIS only works if there are humans to use it. This is a comforting fact as the rest of modern technology is becoming more and more AI generated. This idea was further confirmed with the water well example. Dr. Snow saw an inconsistency in his data and was able to find what caused that inconsistency through some research. He found that his data was sound and the inconsistency was due to outside circumstances. This is not something that a software would be able to figure out (at least I don’t think it is).
I looked up “GIS Applications Chicago Public Schools”. I was interested in finding any information on public schools in Chicago. Instead, I found an interactive map where I could add many different features. The one that stood out to me was “Recycling Drop-off Site.” Being a big city, you would assume we have many of these. But, I can’t even think of one recycling drop-off site. So I clicked this filter and found that there are 6 drop-off sites within a 3 mile radius from my house. This is not a bad number but it was just interesting to see.
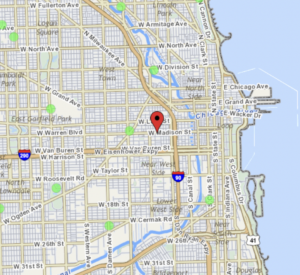
*green dots are recycling drop-off sites
https://gisapps.chicago.gov/mapchicago/
The next thing I looked up was GIS application death rates in the United States. It sounds grousome but I was interested to see where the highest death rates were. I found a map with the ranking for the causes of death. As I zoomed in, the map became more detailed, which is something I learned about in the reading.
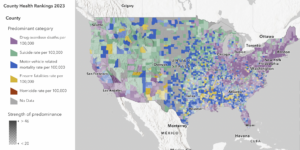
https://www.arcgis.com/apps/mapviewer/index.html?webmap=e323996be3a845b1880f3cdd9381d369