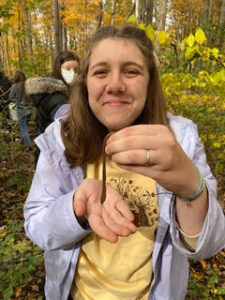
Howdy! I’m Lisa Leonard (I prefer to go by Lee) and I’m a senior studying Zoology and Environmental sciences. I’m from Cambridge, OH. I’m taking this class because I realized I do not know much about GIS and wish to comprehend the program ArcGIS and other GIS-oriented things. I did an REU over the summer involving long term ecological research (Also drought legacies and how plant-soil feedback loops react when a stress variable is added in) and one thing my mentor recommended to me was learning how to work with GIS, so I’m here today. My interests in zoology and environmental sciences are biological indicators, specifically invertebrates, and lichen. I also like to study anthropogenic activity.

lover of annelids <3
I think one thing I heavily appreciated about the readings is the diversity in disciplines. It heavily emphasized that it wasn’t just used in geography, but rather spread across multiple fields. I personally never knew that those outside of the natural science bubble could have a use for GIS, so when I read that GIS was quite literally all around us (From getting your morning cup of Joe to organ donation), it blew my mind. I liked this chapter a lot because honestly I’ve stayed away from GIS because it seemed too complex, but now that I’m reading more about it I feel less intimidated? Stay tuned. It’s a nice dip your toes into the subject chapter in a way. I think it was more cooler seeing the figures than reading about it (i.e. Figure 1.4: Cholera in London in 1854) because that was before GIS was even computerized!
I looked into the different forms of GIS used at the place I did my REU at and found a lot of different images that I didn’t even know existed! Attached is a link to the W.K. Kellogg Biological Station’s Long Term Ecological Research site, where they have various scales of data, from soil to the roads in Kalamazoo county. (https://lter.kbs.msu.edu/data/gis-data/) Try not to click metadata because it has a more coding set up but please look at the images if possible! (The soil one looked so cool!)
For my research, I chose a paper called ‘A GIS-based method of lake eutrophication’, which was a fairly tough read honestly. While it isn’t 100% my preference, I felt it was significant to discuss eutrophication from a GIS sense because eutrophication is a form of anthropogenic activity caused by an overload of various nutrients leaking into waterways (this is usually caused by agricultural practices) and causing a decline in fairly sensitive organisms, such as amphibians. This paper doesn’t shine any light on our poor slimy amphibian friends, but rather discussing a variety of physical, chemical, and biological indicators. (Phytoplankton was the biological! I assume because some species do super swell under stressful conditions, while other species are extremely sensitive to eutrophic environments.) This study took place in a body of water, called ‘Lake Chao’, located in China with HIGH levels of eutrophication. These high levels have impacted the population around them socioeconomically, ecologically, and even caused the population to have some pretty intense health effects. The main GIS aspect these focused on in the results was a lot of spatial distribution, and what areas of the lake were heavily impacted and what parts were not. They actually said that the eutrophication levels and the genuine conditions of the lake were not too far off from each other. However, there is no distinct indicator or parameter that can be evaluated in a simple fashion when it comes to a body of water, but if we put multiple different indicators together to create a distinct evaluation of a lake assessment. I think this paper had a lot of complexity to it and frankly, the photo I’m attaching below from the paper seems intense to even explain

One fragment of figure 3 from the paper. It went from a-f and seemed to be explaining the trophic state index on a spatial scale? This was with the various indicators but holy moly I feel violently humbled.
Source:
Xu, F.-L., Tao, S., Dawson, R. W., & Li, B.-G. (2001, October 30). A GIS-based method of Lake Eutrophication Assessment. Ecological Modelling. Retrieved August 28, 2022, from https://www.sciencedirect.com/science/article/pii/S030438000100374X
This was from a journal called Ecological Modeling.
I also looked into the use of GIS with lichen and was not disappointed with what I found. Air in urban environments isn’t really good in terms of quality, and lichen is a great biological indicator to look at when understanding air quality. In this study they also used moss because lichen and moss both are great at absorbing things, making them great candidates for indicating toxicity in the air. In the article, there was a map (figure 4) showing agglomerations of lichen and moss (Used a high for higher concentrations in different areas) It was so cool to see it because I didn’t really expect GIS to include such microscale pieces of nature. I wonder if there is GIS data on every ant in Michigan. That’s so crazy to me. It also showed a wind rose in figure 2, which showed direction and speed of wind as well as the concentrations of toxins in the air. I think it’s awesome how GIS can have different ways of expressing data like how R can too (or scientists making graphs and different forms of data in general.)
Source:
Długosz-Lisiecka, M., & Wróbel, J. (2014, September 24). Use of moss and lichen species to identify 210po-contaminated regions. Environmental Science: Processes & Impacts. Retrieved August 28, 2022, from https://pubs.rsc.org/en/content/articlelanding/2014/em/c4em00366g/unauth
worms and lichen. seems like a kids book in there somewhere. all good. glad to hear GIS seems less daunting after reading a bit.