Chapter 7:
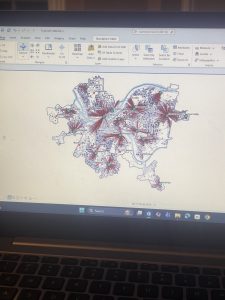
In this tutorial, I learned more about tools used for manual digitization by tracing and a more in-depth understanding of the use of base maps. Base maps will help me edit and create vector map features while also learning how to use other existing layers like streets as spatial guides for digitizing features. Also learned a little about lidar and how it is used as a reference for heads-up digitizing. ArcGIS field maps or GPS receivers that collect data about longitude and latitude to then create vector features and build information modeling, can then be imported into GIS maps creating feature classes. I had some issues when trying to shape and form a building that fits to scale in the map while doing this chapter. This tutorial was definitely one of the easier ones, but it was pretty hard to make vector points when I was confused on the correlation between the directions and my own screen. It took me a while but I eventually got it, I then promptly closed my computer and didn’t reopen ArcGIS until the next day. I think that in general, this chapter had some fairly easy to follow directions, but it also took me a longer amount of time to accomplish. It made me realize that I do better when dealing with point locations on maps, and sometimes have more trouble when working with CAD drawings and using cartography on zoom scale maps. In this chapter, the outlines of buildings in my practice GIS sites were a little askew and not as lined up as in the directions. This can also be said when talking about what the maps looked like and how they differed between my directions and my computer. This caused me to be confused in tutorials like the second one where I had to simply map bus stop locations as points. I was confused because part of the map that I had, differed from the pictures and images that were in the diffraction, causing me to guess at some parts on where points are supposed to go (not to say that mapping these points was a high stakes operation or anything like that).
Chapter 8:
In this chapter, I learned about geocoding and how it matches location fields in tabular data to corresponding fields in existing feature classes in order to map the tabular data. Through these location fields, we are able to geocode their location by using zip code polygon or street feature classes. GIS has to use “fuzzy matching”, and make matches that are approximate as opposed to being one hundred percent accurate. Fuzzy matches are made through rule-based expert system software, ArcGIS is seen as a system. The geocoding expert system can be seen as attempting to mimic a mail delivery person through using expert knowledge to get mail that was messed up or written differently, to the correct address. This can be shown in GIS through source tables, reference data, locator, or the geocoding tool. This tutorial only had two sections so I feel as though I don’t have as much to talk about or say that I had difficulties with (though I definitely did have trouble figuring things out throughout this section and chapter). I do feel like it was easier to run through the two tutorials, especially in comparison to the other chapters and tutorials that I had to push and force myself to finish. This feeling of understanding can be associated with the fact that I paid attention and was learning how to do things and locate different tools and functions white struggling and feeling like I wasn’t learning anything at all, genuinely just following the directions blindly. Although I have great disdain for the “your turn” sections of the reading, they really do check your knowledge, comprehension skills, as well as your problem solving skills while recalling everything that you have previously learned and read about. If I were to go back and compare how I handled these tutorials when I first started this course, confused on where the content pane was, and stressing out forgetting how to symbolize circles with different traits there is a big difference. I would like to think that I am learning and improving, not to say that I’m ready to tackle the final/midterm which has a fast approaching due date. 🙁
I again forgot to take pictures of my work in chapter 7 and 8 so I will be leaving this message here incase I forget to go back and collect images for some of my work.
Chapter 9:
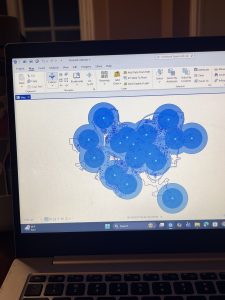
In this chapter I had some issues but it was mostly in relation to the amount of work that I had to do, in relation to the other 2 previous chapters of work. In this chapter, I visualized spatial data so that I and other people can get answers or solutions to problems. I learned about four different spatial buffers including: buffers, service areas, facility location models, and clustering. I also learned about and used another spatial data type, “the network data set”. Which we use to estimate travel distance or time on a street network. We apparently used the free service version in GIS, not that I would have honestly been able to tell the difference between the two in the first place. In the first tutorial, I learned about using buffers for proximity analysis. With a buffer being a polygon surrounding map featured of a feature class. I tough that this first tutorial looked cool, and was fairly easy to do. I will say that I had issues trying to understand what they meant when they said to find the “number and percentage of youths” within a distance after having created a one mile buffer. I was confused because I didn’t really understand how we were supposed to be getting these calculations, or how we were supposed to be comparing them. I was also confused and I believe that I might have done my map wrong because when I compared what I had created to the picture, they had darker shading in the circles then I did. In the third tutorial I also had fun making the map and adding the colors, but my computer kept freezing while I was trying to swap that color out per the instructions so I was getting fairly frustrated.