Chapter 4
Chapter 4 honestly made me realize how easy it would be to mess up a GIS project if you are not organized from the beginning. Before this, I didn’t really think about where data was stored as long as it showed up on the map. But working inside a file geodatabase made everything feel more structured and intentional (and a lot more difficult). Creating the geodatabase and importing feature classes felt simple at first, almost like a puzzle in a way. However, once I started looking at attribute tables, I noticed how technical it actually is. The difference between text and numeric fields seems minor until you try to join something and it doesn’t work. Then it suddenly matters a lot. Editing fields also made me think about how permanent some changes are. Once you delete a field or change a format, that affects everything connected to it. I say this because I sadly had to learn it the hard way. It definitely made me more careful about clicking through steps too fast.
Chapter 5
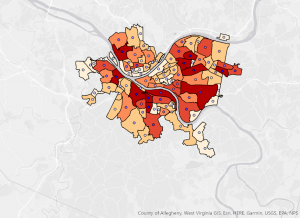
This chapter was probably the one that made me stop and think the most. I’ve heard of coordinate systems before, but actually switching between them and seeing how the map responds made it all real. When the map adopted the State Plane coordinate system automatically, I didn’t realize at first why it changed. Once I understood that the first layer sets the coordinate system for the map, it became more real. I will have to admit that the Census portion took more effort than expected. Cleaning the CSV file, formatting GEOID fields, and making sure everything matched before joining it to the shapefile showed how much preparation happens before visualization. Sometimes, I wish the system would read my mind and all I have to do is click a button when I want it to do something.
Chapter 6
This last chapter felt more active compared to the others. Instead of just organizing or displaying data, I was actually changing it. I found the summing of the housing unit fields during the dissolve process interesting. It showed how powerful these tools truly are. The totals carried over automatically, which is efficient, but it also made me wonder how often people double-check those outputs. Could the computers even get it wrong? Geoprocessing tools feel powerful but also slightly intimidating. If you run a tool with the wrong settings, you could create misleading results without realizing it. That part stood out to me — GIS requires attention to detail the entire time. I can see where mistakes happen though, especially with looking at the complex bright screen for a long time. These tutorials specifically made me realize how easy it would be to misinterpret data if you don’t understand what’s happening behind the scenes. A map might look convincing, but small technical decisions can completely change what it’s showing. These couple chapters most certainly made GIS a whole lot more serious.