Chapter 4
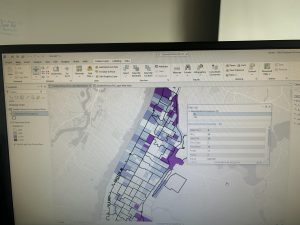
Chapter 4 was about working with spatial databases. I learned that a database is a container for the data of an organization, project, or othre undertaking for record keeping, decision-making, analysis, and research. I found this chapter to be more difficult than the previous chapters, but I found it very interesting who individuals can utilize GIS to import databases directly into ArcGIS Pro. To me, this chapter was the most useful chapter that we have done yet. I can see myself importing data into the database and using it to analyze trends. I did have a bit of trouble importing the map, as it did say that there was a network error. I did have to switch over to another computer and this was resolved.
I also was able to learn about carrying out attribute queries. Linking tabular data to the spatial features in feature classes allows you to symbolize maps using the attribute values found in tables and enables you to find spatial features of interest using attribute data. An attribute query selects attribute data rows and spatial features based on attribute values. Something that I did have a question about was what SQL is. The chapter discusses how attribute queries are based on SQL, which is the de facto standard query language of databases and many apps, including ArcGIS Pro. I am interested in learning more about what SQL is what it entails. One of the more interesting parts of the chapters was viewing crime incidents. I found this to be very interesting. I never thought about how public health officials/law enforcement may be able to map criminal activity in order to look for areas of need and implement appropriate interventions. I did find the “your turn” on page 116 to be specifically hard, as I had a hard time locating the SQL view to remove the parenthesis.
Chapter 5
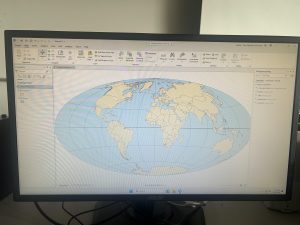
Chapter 5 was about spatial data, and I was able to change the geographic coordinate system to a projected coordinate system by setting the map properites, change the projected coodinate system to a different projected coordinate system by setting the map properites, and set the projected coordinate system for a local-level map by adding a first layer to the map an d specifying the display untis for the map. In 5-1 I learned more about world map projections. I discovered that geographic coordinate systems use latitude and longitude coordinates for locations on the surface of the earth, whereas projected coordinate systems use a mathematical transofmration from an ellipsoid or a sphere to a flat surface and two-dimensional coordinates. This section was very inetesting to learn about the various types of map projections- such as the Hammer-Aitoff projection.
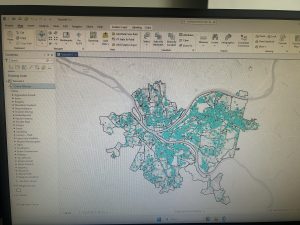
I also found 5-3 to be very interesting, as I was able to change a map’s coordinate system. 5-4 allowed me to examine a shapefile. I was a little confused reading this section on page 134, and was wanting more clarification onn what a shapefile is and why they are important. I understand that a shapefile consists of at least three files with either .shp, .dbf, or .shx and each file uses the shapefile’s name but with a different extension, but I am not too sure how I would use it or what the importance is. I found tutorial 5-5 to be the most interesting, where I was able to work with US Census map layers and data tables. I learned that the advantage of downloading spatial data is that you have more flexibility in modifying it. I was able to download census TIGER files, and process tabular data in Microsoft Excel. I thought the process of adding and cleaning data in ArcGIS Pro was very interesting, and I would like to use this feature in the future, because it would be easy to analyze and interpret data within the same software- and not have to switch around programas.
Chapter 6
Chapter 6 is fundamentally about geoprocessing- which is a framework and set of tools for processing geographic data. 6-1 was about dissolving features to create neighborhoods and fire divisons and battakions. I learned about the pairwise dissolve took, which can aggregate block group attributes to the neighborhood level, using statistics such as sum, mean, and count. In 6-2 I was able to use select by location to create study area block grops. I found this to be very interesting, because the “your turn” was very interestnig I was able to interact within multiple layers. I was able to use the pairwise clip tool to cleanly create street segments. This was useful because clipping Manhattan streets with the Upper West Side boundary cuts off the dangling portions of the streets and creates a clean layer for display purposes. My personal favorite was doing 6-7 where I was able to understand study tracts and fire company polygons. It was very intersting to learn that responsbility for the tract’s population of persons with disabilities should be spilt approximately 50/50. I was able to select tracts to open the disability field, which showed that the population of persons with disabilities in tract is split 50/50 between fire companies 22 and 75, each with 400 persons. Census tract 019300 retains its full population of 1,620 persons with disabilities.
At the end of this weeks tutorial for chapters 4, 5, and 6, I feel as if my GIS skills are improving. At the beginning of the semester, I had no clue what GIS would look like in practice, and using map projections was a big surprise to me- because I did not envision this being a large part of GIS.