Chapter 4:
I found this chapter to be quite content heavy, but it was very interesting as it covered how geographers can import data into a geodatabase and manipulate it from within the app. This manipulation can be done in a myriad of ways, such as directly within the field view table or with the use of python expressions to combine or calculate fields. The chapter also covered the use of different tools such as the Calculate Field tool as well as how to select specific fields using generated expressions. It also had a section on centroids (the arithmetic mean of all the points within the polygon), and how they can be manipulated to influence the presentation of data within ArcGIS. I found this chapter to be the most interesting one we went over this week, and the one I found the most useful.
Chapter 5:
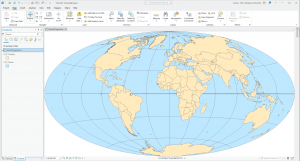
Chapter 5 went over the use of different map projections and how some can be more useful and cause less distortions in the display than others. The chapter also covered how to use and add coordinate (x,y) data; GPS units and many databases provide coordinate data, and said data can be used in GIS from a table to create point feature classes, such as libraries in Chicago. It also covered how exactly to work with outside sources like the US Bureau to import and work with spatial and tabular data. I thought this exploration of spatial data sources was interesting and the chapter explains it very well. I am excited to apply the information covered in this chapter to the final project for the end of the course.
Chapter 6:
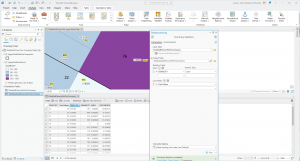
This chapter focused on explaining how block groups, layers and features can be extracted and moved depending on the data needed. It covered how to dissolve block group polygons using the Pairwise Dissolve tool, extracting neighborhoods using attributes from a study area and intersecting features on different attributes. The chapter also went over how to merge, extract and append features using tools within ArcGIS. My favorite part of the chapter was learning how to use the Union tool on the different boundaries to create more detailed polygons. I thought it was a cool feature of ArcGIS to learn about. It did make me wonder about how many features can be merged at one time, and whether said features need to relate to each other or not.
Delaware Data Inventory:
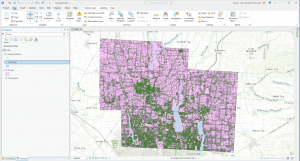
Data Layer Name: Parcel
Description: This dataset shows the extent and ownership of parcel lines within Delaware, Ohio. It is a feature service, and is maintained by the Delaware County Auditor’s GIS Office. When viewed in GIS, it shows the boundaries of different parcels, particularly within the study area.
Data Layer Name: Hydrology
Description: This dataset contains all the major waterways within Delaware, Ohio. It is updated on an as needed basis and is published monthly. In GIS, using a different symbology from the rest of the parcel data can make it easier to distinguish and work with.
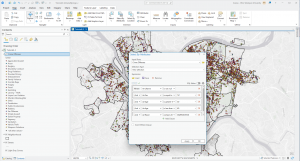
Data Layer Name: Street Centerline
Description: This data depicts the center of pavement of public and private roads within Delaware County. It falls under the Feature Service type, and appears with a simple line symbology when viewed within GIS.
Screenshot: