Chapter 4-
Chapter four focuses on importing data into file geodatabases, modifying attribute tables and fields, using Python expressions to calculate fields, joining tables, getting an introduction to SQL query criteria and carrying out attribute queries. The part of chapter four below was tutorial 4-3, carrying out attribute queries. I had a little bit of trouble with the attribute queries and making sure everything was inputted correctly for it to be able to run. With a little bit of trial-and-error I was able to get the DateOccur values to appear. The little caution buttons that explains what was wrong about the function was extremely helpful to get the parenthesis inputted correctly. I liked the visuals of this map and all the different colors for each crime in the area. I had more trouble with the next part of getting just the frequencies for Burglary and Robbery, due to the colors glitching and not showing correctly. However, I was able to solve it and they eventually all turned the blue color in the picture on page 104. It was also very interesting to learn how to reuse a saved query to reuse a definition query. It was cool o see the number of crimes continue to go down with each step. I also liked how they connected the information I was using back to the area. In one part, it explained how violent crimes are normally clustered in specific areas, while crimes like burglaries are often more widespread. It was cool to read this and be able to visualize it with the map in front of me. The final part of this tutorial had you use multiple Select by Attributes to narrow down to the unsolved burglary to be John Bond. The next step was a Your Turn and had you create a choropleth map with gradient colors choosing your own color scheme. I appreciate these sections because they are helpful to then use the tools learned on your own.
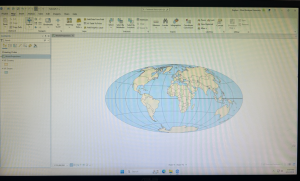
Chapter 5-
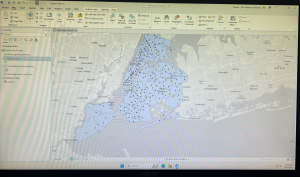
Chapter five focuses on spatial data and the learning goals including working with world and US map projections, set a projected coordinate system, work with vector data formats, and explore sources of spatial data. The first tutorial inserted below was 5-1. This tutorial was the easiest out of all I have done so far, but was helpful to see all the map options and types that can be used through the software. This tutorial had us start with a flat world map and convert it into a rounded version shown below. It was cool to see all the coordinate systems and to learn about the Hammer-Aitoff (world) system that we used. The Your Turn of this section had us do the same thing, but instead with the Robinson (world) projection. The next chapter focused more on the US map projections and the Albers equal-area projection for the country. Also shown below was tutorial 5-4. This tutorial focuses on working with vector data formats. This chapter was a little more complicated that the last few, and required you to find the certain tools it wanted you to utilize. The first step was importing a shapefile into file geodatabase, and being able to add that to the map. This step was self explanatory and I was able to find everything to get the purple overlay of New York City. This chapter also showed how to add X,Y data, which was more tricky to find. With a few google searches I was able to get to the coordinate graphs and tables inserted below. It had you visualize the amount of libraries, which are shown as dots, and the school district boundaries. It also has you learn to just highlight certain aspects, which was highlighting specifically the New York school districts. The rest of chapter five focuses on similar aspects.
Chapter 6-
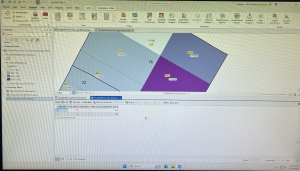
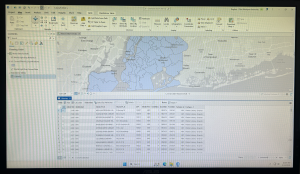
The focus of chapter six is geoprocessing and dissolving block polygons to create divisions, merging water features, apportion data between polygon layers, and appending separate fire and police station layers to one layer. Chapter six covered a lot more complex topics as the last two, and the ones mentioned before were just a few of the learning goals of this chapter. The first few tutorials focused specifically on dissolving features to create neighborhoods, fire divisons, and battalions, extracting and clipping features for a study area, merging water features, and intersecting features. I was very interested by tutorial seven, photographed below. This tutorial focused on the Tabulate Intersection tool. I had some trouble with this chapter finding the tools section and where you can search for the tools needed in these tutorials. After finding it, the rest of the tutorial was much simpler. This tutorial had us look at tracts and fire company polygons specifically in Manhattan. Using the Tabulate Intersection, I was able to apportion the population of persons with disabilities to fire companies. I liked how we were able to visualize both the map and the table, and organize it in a cleaner way by ascending the numbers of the TRACT-ID. This allowed for easier location and made finding things much simpler. With the Your Turn portion, it had you use the Summary Statistics tool to calculate the total number of persons with disabilities in each fire company. It gave the data to input to get these numbers and what to place in the inpust and outpust table, field, statistic type, and case field. The photograph below is what I got in the table after inputting this data. Overall, I had more trouble with chapter six than the other chapters in this section, but it was a lot of useful GIS information.