Chapter 1
In Chapter 1, I was finally introduced to ArcGIS Pro, and I have to say, I was immediately struck by the complexity of the interface. There are just so many tabs, panes, and buttons, I didn’t even know where to look at first. However, as I followed the instructions in the tutorial, I began to get a better understanding of all the different elements. This entire chapter focused on the basic fundamentals, such as opening a project, navigation, bookmarks, attribute tables, and learning to symbolize a map. All of these are probably basic, yet I quickly learned that they are also the foundation upon which all other learning will be built. One of the most important things I learned throughout Chapter 1 was the organization of ArcGIS. For instance, the top ribbon allows me to access different tools, which are then organized by different categories. Additionally, the Contents pane allows me to see the stacking of different layers. Turning different layers on or off, as well as moving them around, also helped me understand the construction of a map, piece by piece. Tutorial 1-3 was also very helpful, as I had never even opened an attribute table before. Learning about all the different data behind a feature helped me realize that there is a lot more to GIS than mapping, as there is also data management. Finally, with Tutorial 1-4, I learned about symbols and labels, which change the entire meaning of a map. At the end of Chapter 1, I must admit that I felt much less intimidated by the program. I didn’t become an expert, by any means, yet I began to get a sense of how the program thinks, which will be important throughout all the other chapters.
Chapter 2
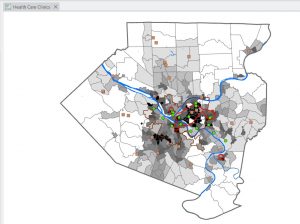
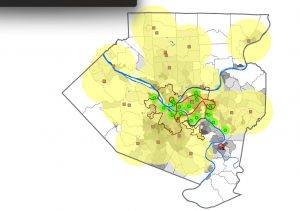
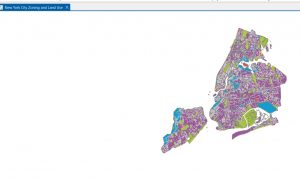
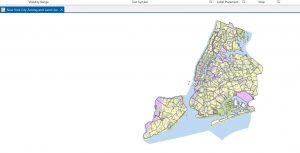
Chapter 2 was all about map design and the various methods of symbology. This was the chapter where I finally started to feel comfortable altering the way maps actually look. It seemed like almost every section required me to alter the colors, values, classification methods, and labels. Although at first this seemed quite repetitive, by the end of the chapter, I saw why this was so important to a GIS analyst. One of the biggest takeaways for me from this chapter was realizing that symbology is not just for looks; it actually affects the way a person will interpret the map. When I was working with different classification methods, the map looked completely different even though the numbers didn’t actually change. This really drove home the importance of choosing the appropriate symbology method for the data. One section that really stood out to me was the section on working with buffers. When I saw the yellow appear as the clinics were buffered, I finally saw the spatial relationships. No more guessing which clinics are close enough; this really helped me understand how someone would use this program to answer questions. I also found working with different datasets, especially the NYC zoning and land use dataset, really helped me speedily work with symbology and understand the visibility range. I finally saw why labels shouldn’t appear at all zoom levels. This chapter really helped me feel more comfortable and not as scared to alter the colors, shapes, etc. I think this chapter really helped me understand the connection between design and communication.
Chapter 3
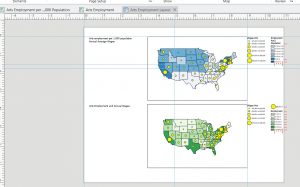
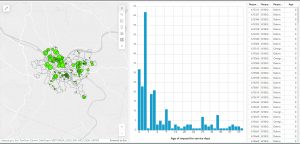
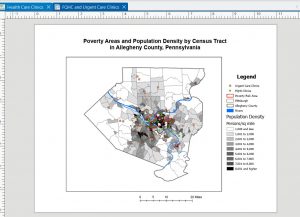
In Chapter 3, there was a shift from creating maps to a greater focus on sharing maps with those who do not use ArcGIS Pro. This chapter also involved a greater level of switching between ArcGIS Pro and ArcGIS Online, which was a little confusing at first since the interface was not quite the same as the book showed. However, once I got accustomed to where everything was, the instructions made a lot more sense. The first section, which was creating a layout, felt somewhat like a graphic design project. I had to place titles, a legend, a scale bar, and a map into very specific areas. This required the use of guides and grids to ensure everything was lined up correctly. I didn’t realize until I had to do this exercise how much goes into creating a final, clean-looking map. Tutorial 3-2 had me share a map to ArcGIS Online. Once this was done, I opened the map in ArcGIS Online, which was a very different experience than ArcGIS Pro. This was a surprise, as I had no idea how different these two platforms were until I had to use them. This section also introduced me to StoryMaps and Dashboards. StoryMaps seems like something that could be used to present a project or idea to others, as the format allows the reader to be walked through the project. It is very well-organized, easy to read, and follows a logical path. The Dashboard was probably the most interesting section of Chapter 3. I enjoyed seeing and creating the green dots on the map and the histogram next to it. I also enjoyed being able to click on different features on the map, which automatically changed the chart. Even though Chapter 3 was probably the most difficult chapter due to the constant switching between platforms, I think it helped me realize how GIS is shared with those who do not use GIS themselves.