Rhoades Week 1

1. Introduction: My name is Hunter Rhoades and I am a Junior majoring in Public Health, Nutrition, SOAN, and Educational Studies with a minor in Biology. As an aspiring epidemiologist, I figured that this course would be great to take – as GIS is often applied to outbreak investigations to identify disease clusters. I am from Zanesville, Ohio which is home to the infamous Y Bridge and Tom’s Ice cream Bowl. Moreover, I’m an RA on campus, a Cooking Matters Coordinator, and involved in our university’s Food Recovery Network. I look forward to see how I can utilize GIS and apply it to the field of public health/epidemiology!

2. Schuurman Chapter 1: I find it really interesting that GIS is being utilized for areas other than geography. For example, I have seen GIS being utilized by Registered Sanitarians at fairgrounds to map which food trucks have passed inspection, failed inspection, or have yet to be inspected. I find the linkage between GIS and public health to be very interesting, as the application allows for quicker visualizations and saves time. I was interested to read about how GIS allows planners to identify residential, industrial, and commercial zones by mapping the exact location and survey coordinations of each taxable property. This allows planners to see impacts on a larger scale in a way that may be hard to do via data analyses or groundwork.

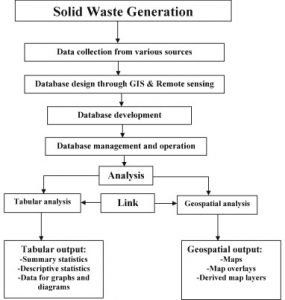
I was very interested in reading about the differences between spatial analysis and mapping, because I have always thought that the two were interchangeable. I learned that spatial analysis generates more information or knowledge than can be gleaned from maps or data alone. On the other hand, mapping represents geographical data with varying degrees of fidelity, in a visual form. It does not create more information than was originally provided, but does provide a means for the brain to discern patterns. To my understanding, spatial analysis is analysis on a deeper level beyond visuals, while mapping just provides visuals.

I was very interested to read about how John Snow utilized mapping during the 1854 Cholera outbreak. This example emphasizes the importance of mapping, as the author states that 50% of the brain’s neurons are used for visual intelligence. Visualization in conjunction with analysis can be a power method to discover outbreak clusters– in other words, visuals can tell stories that allow for researchers/analysts to uncover data/key details about the visual. I believe that the evolution of GIS is essential to uncover trends in data more quickly and precisely.

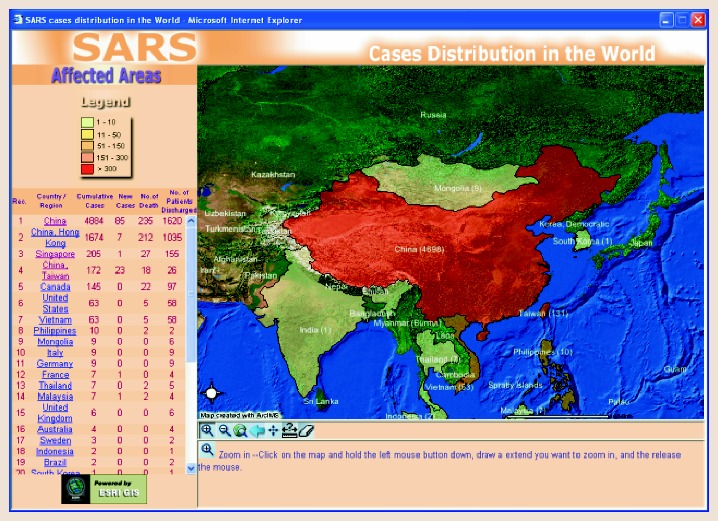
3. GIS Application 1: SARS Cases Distribution in the World

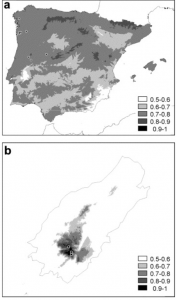
This source discusses the evolution of the application of GIS within Health and Human Services. During the SARS outbreak of 2003, WHO and Hong Kong Department of Health launched an interactive website mapping application to provide current, accurate information on the distribution of SARS in China and surrounding areas. These mapping efforts educated the public and travelers, assisted public health authorities in analyzing the spatial and temporal trends and patterns of SARS, and helped authorities assess and revise control measures.

Source: https://pmc.ncbi.nlm.nih.gov/articles/PMC7121355/

Fig. 29.4

4. GIS Application 2: Emergency Department Usage

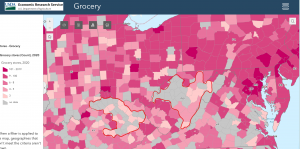
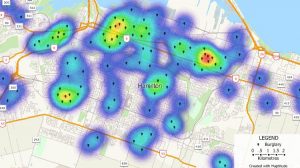
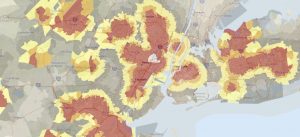
This source discusses how the percentage of emergency department visits change from 2010 to 2012 via zip code. This data was created via Wake County’s (North Carolina) Community Health Needs Assessment (CHNA). This visualization allows for public health officials to understand where need is within the community, and implement proper interventions.

Percent Change in Emergency Department Usage by Zip Code, Wake County Community Health Needs Assessment, North Carolina, 2007-2011

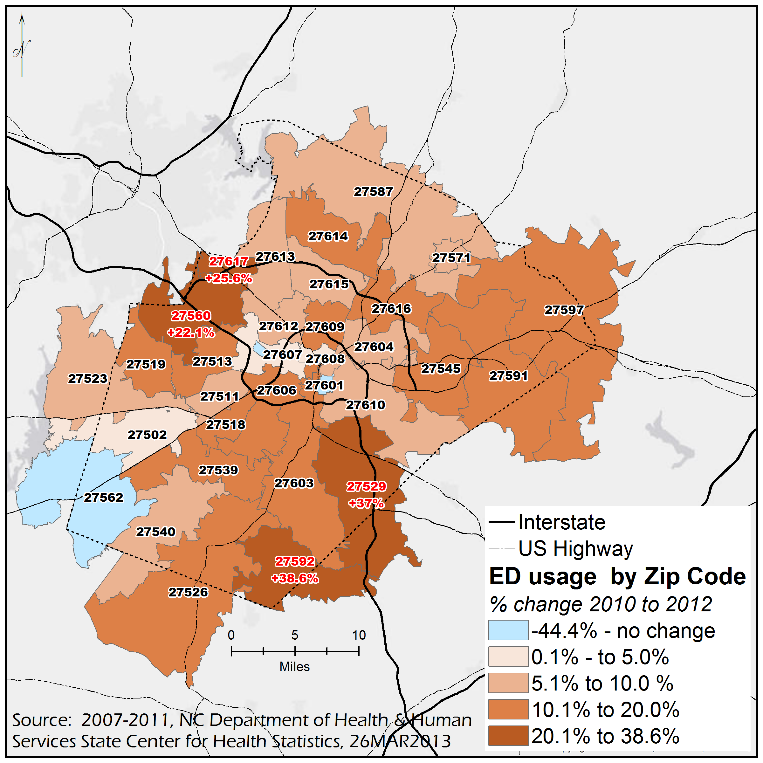
Source: https://sph.unc.edu/nciph/gis/

5: GEOG291 Quiz was completed.

Deem week 1

I have completed the GEOG 291 quiz

Hello! My name is Andrew Deem and I am a freshman at OWU this year. I am from Marion, Ohio which is about a 30 minute drive from campus. I plan to major in botany with a minor in environmental studies because I love plants and the outdoors. I am looking forward to participating in this class and learning more about geography!

Schuurman: This chapter of the book was useful to me for several reasons. Because this is a topic I know very little/no information about, this chapter was able to bring me up to speed on the entire landscape surrounding GIS with a brief summary of its history and how it was gradually developed and accepted in the mapping community. There were times when I was reading that I would be struck with a lot of jargon from this topic that meant little to me, but the author does a good job at providing enough context clues so that an inexperienced reader is able to discern the information anyways. Additionally, I found it interesting how the story of the development of GIS was being told in a way that directly linked it to advancements in computing technology, which made it easier to follow the timeline of events. From this chapter I was also able to gain a greater understanding of how GIS is useful in displaying data in the form of visual information, making it easier to understand. I can appreciate how valuable GIS must be, because I personally see the maps it creates often on the internet. Overall, this chapter taught me about how complicated GIS can be, both GISystems and GIScience are very complex fields which are very important parts of our society and have taken a lot of effort and time to get to the point they are at today. Much of the complexity comes from just how broad this subject is, as while it is foremost a field that specializes in creating maps, it is easily overlooked that ‘creating maps’ in this way requires knowledge on the topic the map is being based on. Because of this, GIS is a highly valuable field that is important to modern life.

GIS application 1: https://experience.arcgis.com/experience/6933ac08a46d43a0a36372cba29299f1


For my first GIS application, I was able to find a map of edible plants that can be foraged across Ohio, and interestingly enough it was on ArcGIS Online. This directly ties in with my interests of native plant taxonomy and foraging.


GIS application 2: https://tacf.org/american-chestnut-range-map/

For my second application of GIS I decided  to find a map displaying the native range of the American chestnut tree, which has been destroyed by an invasive fungus over the past century.

Gist Week 1

Introduction: Hello, my name is Reghan Gist! I am a freshman from Delaware, Ohio and am planning on double majoring in Environmental Science and Zoology. With this degree I would love to do some sort of fieldwork with animals, I love animals and have 4 pets back home! I am also a part of the cross country and track team here at OWU. I am new to GIS, but I am very excited to learn what I can create and do with the software.

Chapter Reflection: The first thing that caught my attention reading this was the explanation of how GIS has experienced a boom of popularity and is used in a variety of different fields. When learning about this class I did not realize how many other non geography related career paths, including Starbucks, would also use this technology. I assumed GIS was used solely for graphing environment related data, which is very wrong after reading. I found it very refreshing to hear that the software is considered confusing because of how different people see it differently. I enjoyed reading about how each person can utilize GIS in a way that best fits their needs and interests. This chapter provided so many examples of what GIS has or could be used for and shows that the opportunities are endless, which can explain why so many are drawn to the technology. I especially was interested in how GIS is affecting our lives even if we do not notice it. Oftentimes I, and presumably others, want something to have a clear and correct identity, however because this chapter provided lots of examples of uses this helped me understand it better. I especially liked the part of the chapter where it explains how GIS impacts society through shaping decisions that affect our lives. Of these impacts, the one that interested me the most was how GIS created crime maps that were able to stigmatize neighborhoods and hazard maps that pointed environmental pollution to be mainly in low-income communities. Overall, through Schuurman’s emphasis on GIS being more than just a software tool and having much larger impacts, I was able to gain a better understanding, learn examples of where it is found in everyday life, and be much more interested in the class and having the opportunity to gain my own experience working with GIS.

GIS Applications (1): Marine Life: One of my interests within the environmental science field is marine life and oceans. I was curious how GIS could be used to gather information on specific marine species and their habitats. Through this search I found an article titled “Using GIS to Analyze Animal Movements in the Marine Environment” (https://www.researchgate.net/profile/Jerald-Ault/publication/249994071_Spatial_modeling_of_fish_habitat_in_Florida/links/00b7d51e967547ab22000000/Spatial-modeling-of-fish-habitat-in-Florida.pdf#page=47) This article provided lots of useful information and graphs on spatial processes and management of marine populations. Specifically, it focused on tracking certain marine animals. The graph inserted below was one of the specific trackings done in this article that focused on the Halibut, a very odd looking fish I had never heard about. It was done in Glacier Bay, Alaska and found a significant amount of the Halibut locations were close to the Rocky reef compared to being in random locations. 

GIS Applications (2): Wildfires: Due to my sister being in California during one of the widespread wildfires, I was very interested in how GIS could or has been used to track these wildfires and provide the graphs and information that we watched on the news while she was there. I found this article (https://www.proquest.com/docview/2179993356?pq-origsite=gscholar&fromopenview=true&sourcetype=Dissertations%20&%20Theses) that focused specifically on tracking wildfires in Santa Barbara that pose threats to the citizens in the area. The student created a web map using local data that allows residents to monitor the evacuation potential, fire size, and emergency updates. This provided a resource to the public to ensure they have access to live information regarding current and past wildfires. There were no graphs provided with the article, however I found it to be extremely interesting and a great way to utilize GIS that could help protect local residents. 

I completed the GEOG 291 quiz!

Mason week 1

My name is Natalia Mason, and I am a freshman studying Zoology (B.S) and Environmental Science (B.A) at Ohio Wesleyan University. I am very passionate about Entomology, Zoology, and Environmentalism. As for my career, I aspire to become an international wildlife biologist, with a specialization in Entomology, so I can make a positive contribution to preserving the ecosystems and species of our planet. Furthermore, I also aim to become a professional author and painter, so that I can use my skills to contribute to the environmentalism movement. I also really enjoy talking about insects and other types of arthropods!

Schurmann Reading:

GIS is integrated into many more real-world data analyses than I had previously thought, although, after learning about it, I have grown to see how critical it can be. Going into this class, I knew of ArcGIS as just a mapping platform; however, the reading had allowed me to see the variety of uses that the mapping platform can be used for among professionals, and I found the description of it being a “scientific approach to a problem” (Schurmann 2) very compelling.  It has also made the purpose of GIS clearer by creating a distinction between mapping and spatial analysis.

The article made a frequent point on the uses of spatial analysis in the environmental realm of research, which helped me to contextualize the importance of this application in my field of Zoology. I had seen many distribution maps regarding animals and plants; however, I did not frequently consider the methods that went into creating those visualizations of data. I am realizing that GIS mapping techniques are presumably much more common than I would have thought before.

A point was made that GIS has many roots in older cartography, while conforming into a modern-day digital format that gives the field an opportunity to grow and expand in new ways. It was interesting to learn that the true roots of GIS are harder to gain a definitive understanding of, as it seems pretty fitting for the platform, considering the fact that the range of uses the application has is not static or clear-cut either. The visual aspect of data quantification was made very apparent by the author, which I find to be very important, as it allows professionals to map complex data in ways that can be understood by the public, even when that data is not perfectly clear.

GIS Applications:

The GIS application I found was a Canadian Database that utilized GIS to map the distribution of Mayflies around different watersheds in Canada, as well as a portion of Maine. The Data trends show that mayflies do not venture very far from watersheds. Because they are a species with an aquatic larval stage and a short adult lifespan, they have to stay near waterways to lay their eggs in a short amount of time.

Source: https://experience.arcgis.com/experience/564d07a04cf6472fb367c702ffe3f4d9/page/Main-Page

My secondary GIS application that I had found was a source covering the occurrence of the first stable population of the invasive Indochina Mantis in Italy. The Researchers covering the article had utilized a platform of ArcGIS to map the localizations of the Mantis populations. An interesting aspect of this study looked at railways and how Mantises are likely being transported along the railway to other urban areas across Italy. This data also gives insight into the hardiness of Indochina Mantises within urban landscapes.

Source: https://bdj.pensoft.net/article/50779/

-I have completed the introductory quiz!

Ramirez Week 1

Personal: I am Natalia Ramirez, a commuter student from Columbus and a freshman at OWU. I am most likely majoring in Environmental Studies & Pre-law. As of right now, I plan to become an environmental lawyer to help improve the environment. I am new to GIS but I hope that it will help me improve my technology skills and my understanding of human impacts on the environment. 

(I usually don’t wear glasses, but I was on a long flight)

Comments on Reading: After reading chapter 1 of the GIS textbook, I realized that there are many layers when it comes to GIScience and GISystems. Before reading, I only believed this system was only used by geographers to study rising sea levels or landscapes in general. It was interesting to learn how GIS is used by everyone. Such as a person using a GPS system to a business corporation analyzing its most popular location. While this is a useful tool, the chapter also mentioned the concern there is for GISystems since the data may be easy to misuse or misinterpret. Which is alarming since many common folk and scientists use this technology. 

Throughout the chapter the main concern about GIS systems was finding an effective way to interpret the data. Mostly because there could be multiple ways to interpret it since the system may note the variable differently depending on the location. In my opinion, would it not be possible to create a system that could interpret the GIS results? Or would it create other questions? It may reduce other problems such as figuring out symbols needed to represent the spatial platform, or the best units for a GISystem.

Additionally, because GIS has various interpretations depending on locations, different countries may adapt it according to their geography. As the chapter mentions, Canada’s GIS compared to the UK or the US is different because of the developers, and geography. Nonetheless, the new GIS system may include everyone. Especially since the chapter mentioned how politicians need to analyze some areas to determine who receives benefits. After reading the chapter, I realized that there is much more to GIScience than what one would normally believe. I made connections to  other topics such as philosophy, feminism, history, and art to help me understand the basis of GIS. 

GIS Application: I personally have many interests but for the exploration I decided to do one in waste reduction and the other with polar bears. For the first source, I found an article that explains how to reduce waste in suburban areas. In this study, the researchers used GIS to track municipal waste and created effective management techniques to reduce it. On the contrary, they would analyze what waste management method was working if an area had low waste. This image explains the methodology used since there was no GIS map:

Source: GIS Municipal Waste Management 

The second article used GIS to track polar bears in the Canadian Arctic in order to study their whereabouts as the Arctic is changing. The researchers specifically tracked where polar bear dens were and whether or not more conservation supplies should be enhanced. This form of GIS is important in order to conserve specialist species such as polar bears. This image is a GIS map of polar bears:

Source: GIS Polar Bear Den Tracking 

Quiz: I have competed the quiz.

Ogrodowski Week 1

My name is Lily Ogrodowski, and I am a first-year student from Toledo, Ohio. I’m planning on an environmental major (not sure which one yet!), but I’m also pursuing studies in Chemistry. I may also pick up Sociology/Anthropology, or even Public Health. I have a particular interest in the study of freshwater and lakes/limnology, as well as human geography issues like populations, land use, and urban planning.

Schurmann Ch. 1

In my first week of this class, I completed the introductory quiz which reinforced directives on the syllabus. Then, I read Schurmann Chapter 1, Introducing the Identities of GIS. This introductory chapter has given me a solid introduction to GIS and its uses, history, and impacts. I’ve learned that GIS is more than just digital maps—it emphasizes spatial analysis techniques. While mapping “shows” land features, it seems like applying spatial analysis takes that data and “tells” about patterns the data may reveal. With GIS, spatial analysis can be done while combining many different data sets and maps, proving that GIS is ultimately an interdisciplinary tool with uses that extend far beyond geography alone.

A main focus of the chapter is the comparing and contrasting of the two definitions of GIS: Geographic Information Systems and Geographic Information Science. The author defines GISystems as the mapping and analysis methods coded into GIS programs, while GIScience is the research and theory going on behind the scenes. GISystems are generally accepted and used, while GIScience is the ongoing research and theory development that asks questions about these systems and how they apply in different areas. GISystems are the tools, while GIScience involves taking the tools and tinkering with them.

Additionally, GIScience is most impactful when specific local knowledge is taken into consideration. In the chapter’s example of public wells being linked to cholera cases, a specific understanding of the location of focus inspires a most efficient use of GISystems, thanks to GIScience. However, because GISystems are formulated by people, that means they will inevitably have bias or limited perspectives. The chapter concludes by describing a main goal of future GIS development as involving the integration of multiple ontologies, or conceptual systems of thinking and organization within GIS.

Before reading this chapter, I don’t think I realized how prevalent GIS is in the development of our world. It makes sense that GIS models would be used in agriculture, transportation, energy, and housing, but I did not realize the extent to which GIS plans with efficiency and optimization in mind.

GIS Applications

The first GIS application I found was the Food Environment Atlas from the United States Department of Agriculture (USDA) Economic Research Services. I clicked on the Grocery data set, which shows the number of grocery stores in each county. (The darker the shade of pink means more grocery stores.) I found lots of large zones with few grocery stores or no data in the Appalachia region of Kentucky and West Virginia. (I outlined them with my computer’s Draw tool.) 

I know from research in other classes that these regions face very low income rates, and they are home to food deserts, or places with inadequate access to healthy food.

Grocery | Food Environment Atlas

Next, I found an application from the National Centers for Coastal Ocean Science (NCOOS) that forecasts harmful algal blooms in Lake Erie. I went into the archived videos to find a date with high levels of algal blooms and settled on July 25, 2023. This application is a good example of how overlaying different data sets, like cyanobacterial density and wind patterns, is what makes GIS helpful when explaining the reasons for the trends we see. 

Bloom Position Forecast – NCCOS – National Centers for Coastal Ocean Science

Downing Week 1

  1. Introduction: My name is McKenna Downing, and I am a senior who is majoring in Zoology and minoring in Environmental Science. I am from Pleasant Hill, Ohio, which is 30 minutes north of Dayton. I am on the cross country and track and field teams as a distance runner. After graduation, I plan to find a job in wildlife rehabilitation and environmental education at a nature center (preferably somewhere warmer than Ohio). I am new to GIS but very interested in how it can affect many areas of science, especially in terms of deforestation and land loss.
  2. Schuurman Chapter 1: Nadine Schuurman begins Chapter 1 by illustrating GIS as a large system, not a specific tool with a fixed or secure identity. Different companies or organizations use GIS for their specific jobs, and do not consider what others use it for. GIS dates back to the 1960s, when pieces of paper were layered on top of each other in order to find the best route for a highway. I think that’s really interesting because a problem that seemed difficult was made easy using a form of GIS. There were many people who were involved in the technology of GIS, such as Roger Tomlinson and Lee Pratt, who created the first computer cartography system to create a map of an area featuring all geographic features. I think that it is also interesting that GIS came around when it did, when information was being translated into technological terms and being distributed that way. The main way Schuurman tells us GIS was used in the early stages was to map data distributions, particularly within the environment. It makes me curious if these people would know how much of an effect it would have on the future! She then goes on to discuss how some GIS researchers perceive the system as a way to increase accessibility for spatial analysis. I think that’s really cool because there are so many professions in the world that can benefit from using this system. I also love the idea of GIScience and GIScientists. The classification of spatial entities can be difficult, because people can easily disagree on these parts. An example of this that Schuurman mentions is how to define where a mountain stops and the foothills begin. And it’s so cool that John Snow was able to use the concepts of GIS to figure out the cholera outbreak! I really liked how this chapter discussed how we use GIS in our daily lives, mostly without even realizing it. So many people use this system in different ways, and Schuurman wrote and described it very well.
  3. GIS Applications (1): Wildlife Migration: Understanding the migration of wildlife is incredibly important, and this research paper focused on how scientists used GIS mapping techniques to track the migration of wildebeest across the Serengeti-Mara habitat. The research included the mean routes of the wildebeest across the landscape and the amount of green space before and after the wildebeest had come through. The results found that the less green space in an area before the wildebeest arrived, the less likely they were to travel through that area because of the lack of water. Source: Musiega, D.E. and Kazadi, S.-N. (2004), Simulating the East African wildebeest migration patterns using GIS and remote sensing. African Journal of Ecology, 42: 355-362. https://doi.org/10.1111/j.1365-2028.2004.00538.x
  4. GIS Applications (2): Plant Conservation: This research paper focused on using GIS methods in order to implement plant restoration programs in Portugal. They focused on bryophytes and how they grew within a natural reserve with different species of vegetation, including alien species of plants, and varying levels of altitude. The researchers collected information from the reserve using aerial GIS mapping. it was found that the bryophytes all had differing levels of need within the reserve, with some doing well at altitude and others not. The alien species (invasives), also played a part, because they would grow quickly and outcompete the endangered bryophytes. GIS was helpful in finding these results, and is demonstrated in the map below. Source: https://www.sciencedirect.com/science/article/pii/S0006320703001253
  5. I completed the GEOG 291 Quiz!


Pichardo – Week 1

1. Introduction

Hello, my name is Andrea Pichardo, and I am an ENVS student interested in understanding how geography and technology intersect to explain real-world issues. I am especially interested in how spatial data can be used to analyze social and environmental patterns, such as access to resources, environmental impacts, and community-level change. I am new to Geographic Information Systems, but I am excited to learn how GIS tools are used across different fields and how they influence decision-making in everyday life.

2. Comments on Schuurman:

In Chapter 1, Schuurman explains that GIS is much more than a tool for making maps. One idea that stood out to me is that GIS does not have a single, fixed identity. Instead, its meaning changes depending on who is using it and for what purpose. For some people, GIS is mainly software that helps organize spatial data, while for others it represents a scientific way of thinking about space and spatial relationships. This made me realize that GIS is not just technical, but also conceptual and interpretive.

I also found the distinction between GIS as a system and GIS as a science especially interesting. GISystems focus on practical tasks such as urban planning, transportation routing, or managing infrastructure. GIScience, on the other hand, asks deeper questions about how spatial data is created, categorized, and analyzed. Schuurman emphasizes that decisions like where boundaries are drawn or which data is included can significantly affect results. This challenged my assumption that GIS outputs are always neutral or objective, and it made me more aware of the role human choices play in shaping geographic information.

Another important theme in the chapter is visualization. Schuurman explains that maps and spatial images allow people to see patterns that might not be obvious in tables or written descriptions. The example of John Snow’s cholera map shows how visualizing data spatially can lead to meaningful insights and real-world change. At the same time, she points out that visualizations can oversimplify complex situations if users do not critically examine the data behind them.

Overall, this chapter helped me see GIS as a powerful tool that influences how we understand space, make decisions, and interpret the world, rather than just a technical mapping skill.

3. GIS Application Areas

Application 1: Crime Mapping and Public Safety

GIS is widely used in crime analysis to map crime incidents, identify hotspots, and allocate police resources more effectively. Law enforcement agencies use GIS to analyze spatial patterns of crime over time, helping them predict where crimes are more likely to occur and develop targeted prevention strategies. Crime maps also allow communities and policymakers to better understand safety concerns and evaluate the effectiveness of interventions.

Map/Image:

Kernel density crime map showing areas of higher incident concentrations — a common GIS technique used by law enforcement to identify hotspots.

Sources:

•National Institute of Justice, GIS and Crime Mapping

•Chainey & Ratcliffe (2005), GIS and Crime Mapping

Application 2: Environmental Monitoring and Conservation

GIS plays a crucial role in environmental science by helping researchers monitor ecosystems, track land-use change, and manage conservation efforts. For example, GIS is used to map wildlife habitats, analyze deforestation, and assess the impacts of climate change. By layering environmental data such as vegetation, elevation, and human activity, GIS allows scientists to make informed decisions about conservation planning and resource management.

Map/Image:

Environmental justice screening map that combines environmental and demographic data to highlight areas with higher cumulative burdens.

Sources:

•ESRI, GIS for Environmental Management

•Turner et al. (2001), Landscape Ecology in Theory and Practice

4. Was the quiz completed?

Yes.