Mitchell Chapter 1:
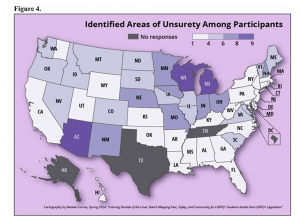
Chapter 1 starts out by discussing that GIS analysis is a process for looking at geographic patterns in your data and at relationships between features. I do have experience with GIS analysis during my internship last summer at the Delaware Public Health District. During my internship, I was able to gather surveys- and upon completion, participants dropped a pin (via ArcGIS) indicating which part of Delaware County they resided in. Afterwards, participants indicated their experience with food accessibility and security based on their surrounding geographic area. Based on this GIS analysis, we were able to see which areas of Delaware County were lacking in accessibility and security, and therefore place proper interventions to help those select communities in need.
The chapter goes-on to explain that geographic features are discrete, continuous phenomena, or summarized by area. Discrete includes locations and lines where the actual location can be pinpointed- and at any given spot, the feature is either present or not. Continuous phenomena includes precipitation or temperature- which can be mapped anywhere. Phenomena are data that “blanket the entire area you’re mapping- there are no gaps”. This expression that the author used to describe continuous phenomena made it very simple for me to understand, as the term was confusing to me at first. Summarized data represents the counts or density of individual features within area boundaries. Some examples of these types of features include, “the number of businesses in each zip code, the total length of streams in each watershed, or the number of households in each county”.
Overall Mitchell’s Chapter 1 allowed me to think more analytically regarding GIS. Prior to this chapter, I believed that GIS was a lot of plugging data into existing databases. However, this chapter challenged that idea and made me realize that one also must understand what type of data they are working with, and how to use that appropriate data to make sense of it during analysis.
Mitchell Chapter 2:
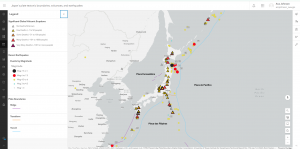
This chapter discusses the basis of how to map features and where features are located. The purpose of mapping features is to look at the distribution of features, rather than at individual features, so that you can see patterns that better help understand the area that you are mapping. I see this being able to be used in epidemiology, for example. If a citizen is concerned about cancer rates in a neighborhood, an epidemiologist is able to gather information, plot the data, and analyze frequencies in order to determine if cancer is prevalent in one neighborhood rather than another. Analyzing frequencies also allows for interventions to occur to help communities– and in this case, public health officials can analyze the neighborhood to determine the cause of the cancer rates.
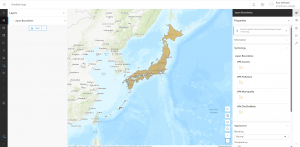
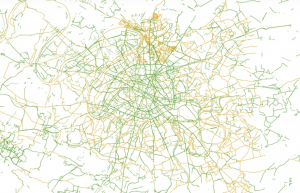
I thought it was very interesting that when creating a map, you tell the GIS which features you would want to display and what symbols to use to draw them. I found this interesting because I thought that you had to create a map entirely from scratch, but it is very interesting to know that the platform provides displays and symbols to choose from. I also learned more about the function of GIS– and that it stores the location of each feature as a pair of geographic coordinates or as a set of coordinate pairs that define shape. Moreover, for individual locations, the GIS draws a symbol at the point defined by the coordinate for each address. For linear features, the GIS draws lines to connect the points that define the shape of streets.
Overall, I found this chapter interesting because I was able to learn more about how GIS functions, which seems to be primarily based on geographic coordinates. I am very excited to start working with the GIS software, and I feel as if this chapter lays a foundation for my understanding to create maps, understand how GIS works, and how to apply features.
Mitchell Chapter 3:
The chapter discusses how to map the least and the most, which allows you to compare places based on quantities, so that you can see which places meet your criteria, or understand the relationship between places. The chapter discusses that public health officials may map the number of physicians per 1,000 people in each census tract to see which areas are adequately served and which are not. It also discusses the type of features you are mapping, which are discrete features and continuous features. Discrete features are individual locations, linear features, or areas. On the other hand, continuous phenomena can be defined areas or a surface of continuous values.
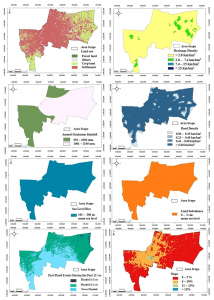
A large portion of the chapter included counts, amounts, ratios, and classes. A count is the actual number of features on a map, while an amount is the total value associated with each feature. However, it may not be the best to use counts and amounts if you’re summarizing by area, as using them can skew the patterns if the areas vary in size. Instead, ratios should be used to accurately represent the distribution of features. Classes were a new concept to me, and group features together with similar values by assigning the same symbol, and specify upper and lower limits. You can specify the classification scheme and number of classes, and the GIS will calculate the upper and lower limit for each class. The four most common schemes are natural breaks, quantile, equal interval, and standard deviation. Natural breaks are good for mapping data visuals that are not evenly distributed. Quantiles are good for comparing areas that are roughly the same size and mapping the data in which values are evenly distributed. Equal interval is useful for presenting information to a nontechnical audience. Equal intervals are easier to interpret since the range for each class is equal, and this is especially true if the data values are in percentages. Lastly, standard deviation is good for seeing which features are above or below an average value.