My name is Kainaat Aslam, and I am a senior at Ohio Wesleyan University. I decided to take GEOG 291 to make myself more comfortable working with spatial data and to gain knowledge of how GIS is actually used in life. I have not really worked much with GIS before, and I am excited to see how mapping and visualization all come together. I like to travel, go out with my friends and explore different places of interest so learning more about geography tools actually feels pretty connected to my interests. I am working and going to school at the moment; hence, I like that this class is flexible and allows me to stay on top of my work with weekly due dates. I have also completed the GEOG 291 Quiz.

Schuurman Chapter 1 Response
In Chapter 1, I learned about the importance and widespread usage of GIS. I have come to realize that GIS is everywhere and that it influences almost every field of study. Schuurman starts off by demonstrating that GIS is involved in numerous fields that people would not associate with GIS. She presents examples such as navigation systems, policing, organ donations, detecting clusters of diseases, agriculture, archaeology, and even the placement of businesses. I was struck by the rapid development of the technology to the point that many people now rely on it on a daily basis without being aware of the degree to which it influences their decisions in life. Schuurman observes that many geographers have a kind of ‘love-hate’ relationship with GIS technology because of its strengths and weaknesses.
Another important concept that stood out in my mind during the reading was the “identity problem” of GIS. What I mean by that is that GIS does not mean one single thing; its definition varies depending on the user’s perspective. A city planner might think of a GIS as a computer program that finds boundaries or locates a property, while a researcher might think of a GIS as a science that concerns itself with the way spatial phenomena are represented in computers.
Another concept that came to mind while reading this chapter is that GIS has both technical and philosophical roots. She mentions some research done in the 1960s that would later influence computerized GIS systems such as the early Canada GIS. The chapter also makes the point that GIS isn’t neutral. The choices people make about things like boundaries, categories, scale, and how the map is displayed all shape the way the information ends up being interpreted. There is always some decision-making involved with GIS that will affect what people interpret from their use of the program. This chapter helped me understand that GIS is not just software but rather an approach to thinking about places and what they mean.
GIS Application 1: Public Health and Disease Mapping
GIS technology is commonly used in the field of public health. GIS can track disease outbreaks and the spread of disease. An outbreak can often be represented as clusters or groups. Using the technology, public health officials can easily pinpoint the areas that are most affected by a disease and plan the most appropriate course of action. Outbreaks tend to occur in clusters on a map, and GIS helps health departments visualize where these clusters are occurring and how they are changing over time. By adding environmental information, population density, or transportation routes on top of the case information, health officials can begin to identify what might be driving the spread of the disease. This makes GIS useful not only for identifying where the disease is occurring, but also for beginning to form hypotheses about why the disease is occurring in a particular place.
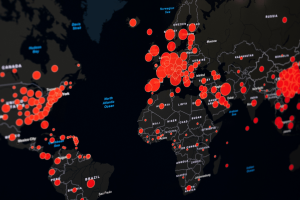
https://www.cdc.gov/field-epi-manual/php/chapters/gis-data.html
GIS Application 2: Crime hotspot Analysis
Another important application of GIS is the study of crime patterns. Police departments create maps to represent the areas in which various types of crime are occurring and use GIS to identify “hotspots,” or areas that experience repeated or high volumes of crime. This helps to identify the areas that need to be targeted by police patrols or crime prevention programs. Crime mapping also enables the study of the relationship of various environmental factors to crime patterns. Hotspot analysis aids in the identification of crime trends and the evaluation of the effectiveness of crime prevention strategies.
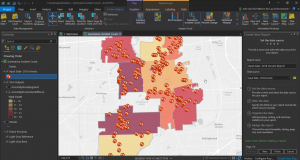
https://www.esri.com/en-us/industries/law-enforcement/strategies/crime-analysis