
Introduction: My name is Jessie Spurling, and I am a senior majoring in Biology and Psychology. I’m from Lancaster, Ohio (Hocking Hills area). My on-campus activities include being on the softball team, a tour guide, and a member of the Delta Zeta sorority. After college, I intend to pursue a career in conservation/ecology or environmental education, and I feel that GIS will significantly help me with those future endeavors.
Schurmann Chapter 1: In the first chapter of GIS: A Short Introduction, Schuurman explains what Geographic Information Systems (GIS) are and why they are important. She starts by defining GIS as a way to collect and analyze data that is connected to location. What stood out to me most is that she makes it clear early on that GIS is not neutral. Even though maps and data often look objective, they are created by people, which means human choices and biases are always involved (boo).
Schuurman also explains how GIS works by combining maps, databases, and computer technology. She talks about layering data, such as putting population information on top of environmental or political data, to better understand patterns and relationships. This helped me understand why GIS is such a powerful tool and why it is used in so many areas like city planning, environmental studies, and public health.
Another important point in this chapter is how much influence GIS can have. Schuurman explains that because GIS outputs look scientific and authoritative, they are often trusted when making decisions or policies. However, she warns that if the data going into GIS is incomplete or flawed, the results can still look convincing even if they are inaccurate. This made me think more critically about how much we trust maps and data without questioning where they come from.
GIS Applications: The first GIS application I looked at was Assessment of habitat suitability and connectivity across the potential distribution landscape of the sambar (Rusa unicolor) in Southwest China. This application uses GIS to map where sambar deer are most likely to live and how different habitat areas are connected. I focused on the habitat suitability map, which shows areas ranked from low to high suitability. Darker shades on the map represent areas that are more suitable for the sambar.
I noticed that the most suitable habitats were clustered in mountainous and forested regions of Southwest China, while areas with lower suitability appeared in more developed or fragmented landscapes. Some of the high-suitability areas were separated by large regions of low suitability, suggesting that the habitat is not well connected.
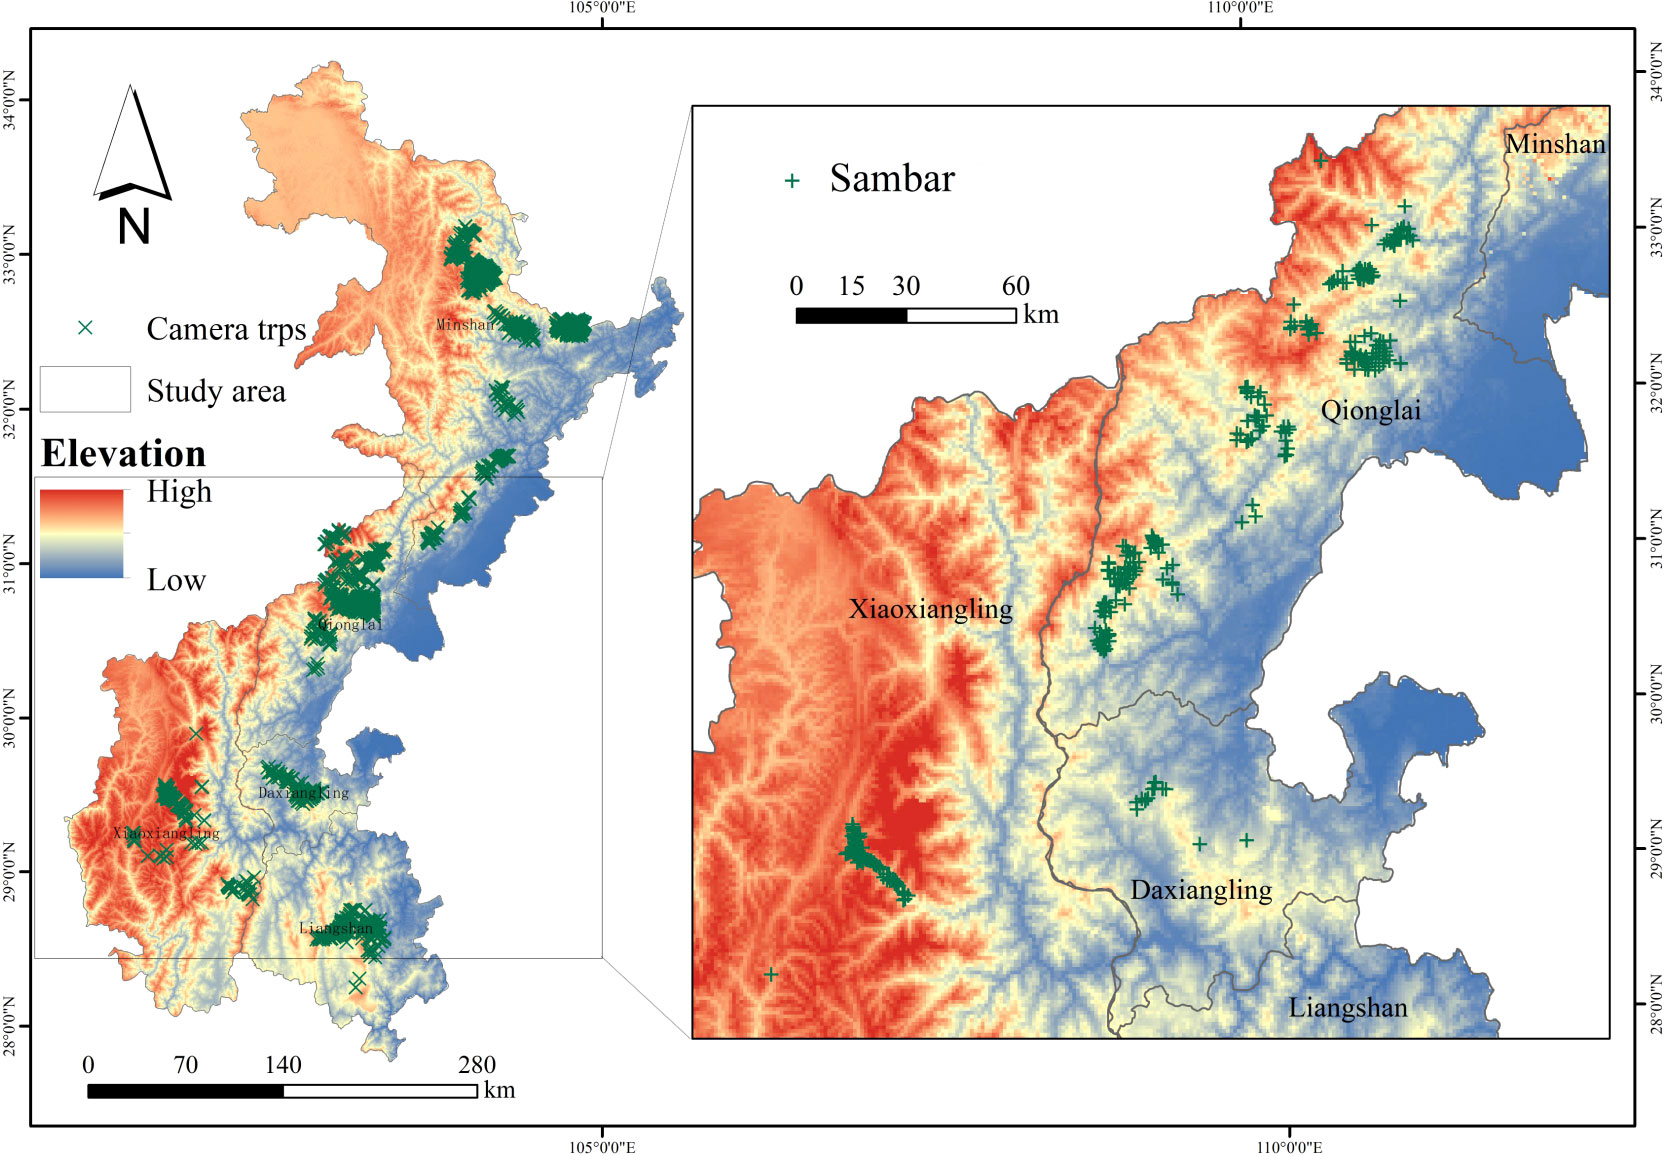
Front. Conserv. Sci., 19 January 2023 Sec. Animal Conservation Volume 3 – 2022 | https://doi.org/10.3389/fcosc.2022.909072
The next GIS application I examined was Impacts of spatio-temporal change of landscape patterns on habitat quality across the Zayanderud Dam watershed in central Iran. This study uses GIS to analyze how land use and land cover have changed over time and how those changes affect habitat quality. I focused on the habitat quality maps, which show areas ranked from low to high quality. Darker colors on the map indicate higher habitat quality, while lighter colors represent more degraded habitats.
I noticed that areas closer to urban development, agriculture, and the dam itself showed lower habitat quality over time. In contrast, regions farther from human activity, especially natural and undeveloped areas, tended to maintain higher habitat quality.

Phillips, S. J., Anderson, R. P., & Schapire, R. E. (2006). Maximum entropy modeling of species geographic distributions. Ecological Modelling, 190(3-4), 231–259. https://doi.org/10.1016/j.ecolmodel.2005.03.026
Quiz: Taken.