1. Introduction

Hello, my name is Andrea Pichardo, and I am an ENVS student interested in understanding how geography and technology intersect to explain real-world issues. I am especially interested in how spatial data can be used to analyze social and environmental patterns, such as access to resources, environmental impacts, and community-level change. I am new to Geographic Information Systems, but I am excited to learn how GIS tools are used across different fields and how they influence decision-making in everyday life.
2. Comments on Schuurman:
In Chapter 1, Schuurman explains that GIS is much more than a tool for making maps. One idea that stood out to me is that GIS does not have a single, fixed identity. Instead, its meaning changes depending on who is using it and for what purpose. For some people, GIS is mainly software that helps organize spatial data, while for others it represents a scientific way of thinking about space and spatial relationships. This made me realize that GIS is not just technical, but also conceptual and interpretive.
I also found the distinction between GIS as a system and GIS as a science especially interesting. GISystems focus on practical tasks such as urban planning, transportation routing, or managing infrastructure. GIScience, on the other hand, asks deeper questions about how spatial data is created, categorized, and analyzed. Schuurman emphasizes that decisions like where boundaries are drawn or which data is included can significantly affect results. This challenged my assumption that GIS outputs are always neutral or objective, and it made me more aware of the role human choices play in shaping geographic information.
Another important theme in the chapter is visualization. Schuurman explains that maps and spatial images allow people to see patterns that might not be obvious in tables or written descriptions. The example of John Snow’s cholera map shows how visualizing data spatially can lead to meaningful insights and real-world change. At the same time, she points out that visualizations can oversimplify complex situations if users do not critically examine the data behind them.
Overall, this chapter helped me see GIS as a powerful tool that influences how we understand space, make decisions, and interpret the world, rather than just a technical mapping skill.
3. GIS Application Areas
Application 1: Crime Mapping and Public Safety
GIS is widely used in crime analysis to map crime incidents, identify hotspots, and allocate police resources more effectively. Law enforcement agencies use GIS to analyze spatial patterns of crime over time, helping them predict where crimes are more likely to occur and develop targeted prevention strategies. Crime maps also allow communities and policymakers to better understand safety concerns and evaluate the effectiveness of interventions.
Map/Image:
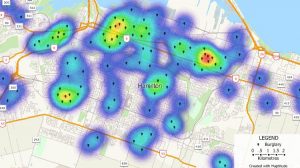
Kernel density crime map showing areas of higher incident concentrations — a common GIS technique used by law enforcement to identify hotspots.
Sources:
•National Institute of Justice, GIS and Crime Mapping
•Chainey & Ratcliffe (2005), GIS and Crime Mapping
Application 2: Environmental Monitoring and Conservation
GIS plays a crucial role in environmental science by helping researchers monitor ecosystems, track land-use change, and manage conservation efforts. For example, GIS is used to map wildlife habitats, analyze deforestation, and assess the impacts of climate change. By layering environmental data such as vegetation, elevation, and human activity, GIS allows scientists to make informed decisions about conservation planning and resource management.
Map/Image:
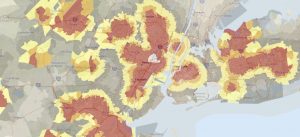
Environmental justice screening map that combines environmental and demographic data to highlight areas with higher cumulative burdens.
Sources:
•ESRI, GIS for Environmental Management
•Turner et al. (2001), Landscape Ecology in Theory and Practice
4. Was the quiz completed?
Yes.