Duncan- Week 5

Chapter 4

  • In Chapter I learned how to import data into my new works, as well as how to modify attributes within the attribute table.
  • In the map below I learned how to focus on a couple of data points within the data set. the green is specifically just robberies and burglaries out of all the crime within Pittsburgh.
  • Additionally I learned how to create spatial joints which give the amount of instances within a certain area of the map.

Chapter 5

  • In this chapter I learned how to un-skew the map and make the maps in the world shape.
  • I learned about the process to change a maps coordinate system.
  • Then I learned about TIGER files and census tracts.

Chapter 6

  • In this chapter I learned how to dissolve features on my maps to either make maps simpler or more advanced, depending on what the idea of the map is and the target audience.
  • I also learned how to merge water features and other features in general.
  • Finally, I learned how to intersect features and what the tabulate  intersection tool is.

Duncan- Week 4

Chapter 1

  • In chapter one I learned a bunch of easy little things like how to zoom and move the map around to where I need.
  • I also learned about how to access pop up windows and how to disable them as well, and I learned about bookmarks and how to create them as well.
  • I learned how to turn off and on features of the map so i can cater it to be what I want as well how to access the tables of data for those features.
  • Additionally I learned how to view the map in 3-D and that was really cool too!

Chapter 2

  • In chapter two I learned how to resize, reshape, and recolor symbols on maps.
  • I learned how to make histograms
  • I learned how to color in borders and define the boundaries of the borders without it being confusing to the reader.
  • I learned how to put limits on labels so they won’t show up while you zoom out.

Chapter 3

  • Chapter three taught me how to put maps on a document, as well as how to label them and make legends for them.
  • This chapter also tells us how to share maps to the web.
  • I also learned how to format pages and add guide lines so that the information presented can be shown in a symmetrical and appealing way.
  • The maps below are what I made during this chapter.

Tadokoro, Week5

Chapter 4

In Chapter 4, I learned how to import, transform, and manage data using a file geodatabase.
I also practiced applying Python expressions and SQL queries to calculate and edit fields, as well as joining tables for efficient analysis.
I found it especially interesting that queries can be used to narrow down suspects in crime data.


Chapter 5

This chapter explains how to work with spatial data by learning about geographic coordinate systems, map projections, vector and census data, and how GIS uses location information to analyze and understand spatial phenomena. I was able to follow the steps up to Tutorial 5-4, but in Tutorial 5-5, even though I created and downloaded the Excel file, an error occurred and I couldn’t complete it.


Chapter 6

In this chapter, I dissolved block group polygons to create neighborhoods, fire battalions, and divisions, extracted neighborhoods using attributes to form a study area, and used that area to extract features from other layers. I also learned how to calculate street lengths for fire service, which was interesting. I was able to learn this chapter smoothly.

Patel – Week 4

Saving Project Name


Project (next to map,insert, analysis, etc tab) → save project as


Name Tutorial number Name.aprx


Displaying a Map


Bookmarks→map of choice


Basemaps


Basemaps = layers for what you wish to represent (rivers, topography, etc)


Contents Pane


View + Pane = select contents 


Contents = selector for what layers you wish to eliminate and keep 


Catalog Pane


 View tab → windows group → Catalog Pane


Allows for easy access to all project components


Export Layer tool


Share tab (after project, map, insert, etc under the logo in left top corner) → export layer


Saving Images


  1. On the File Type drop-down menu, click PNG.


  1. For Name, click the Browse button, browse to save the file to your top, and rename it FQHCAndUrgentCareClinics.png.


  1. For Resolution, type 150.


  1. On the Color Depth drop-down menu, click 24-bit True Color.


  1. Click Export to run the tool.


T: 1-2 Navigating Map Display


Navigation of Map


Map tab→full extent→explore button = center map/info on features


Bottom right buttons do things


Wheel button Zooms in 


Map Back button


Map tab→Navigate→ arrows


Turing all Feature classes on/off = ctrl on press hold + check box click = on/off for all


Bookmarks


Bookmarks = zooms to thing you select


Creating new bookmarks = bookmarks (navigate) + new bookmark + name


Manage bookmarks = bookmarks (navigate) + manage bookmarks


Selecting Attributes data = Right clicking + attribute table + select by attribute = where + Name + is equal to + location 


Week 4 Pics


Buco-Week 4-

Chapter 1

  • It is important to have a base map so that way it can help orient the users location. 
  • When working with layers you can see what order the features are draw in by going to the contents pane. 
  • To be able to look at attributes you can look at attribute tables. 
  • When using GIS you need to be able to do symbolizing which can help organize different features on the map. 

Chapter 2

  • Some different graphic elements that are important on maps are lines. Shaded areas, symbols and text.
  • You can shade text to prioritize different letters or numbers. 
  • A choropleth map uses colors in polygons to represent number values since it is hard for the human eye to distinguish small changes in graphic elements.
  • Dot density maps usually display a total number randomly across a statistical unit. 
  • When looking at features on a map you can turn different feature layers off and on using visibility ranges.


Chapter 3

-When you start a layout it starts out blank so you can add one or two maps.

 -When adding maps you can use guide lines to line up the map(s), titles, and keys/legend.

– You can also use layouts that can be exported to show people who do not use Gis and to use in other software if needed. 

– You can also view the same maps on different devices. 


Thompson – week 4

Chapter 1 – This chapter really focused on just the basics of ArcGIS and learning how to use it. It helped me learn how to navigate basic maps and work with different types of data and tables. This chapter was really helpful in learning how you can incorporate symbols and labels into your maps as well and how you can work with things like 2D and 3D maps. It was overall just a super basic introduction to the technology and mapping.

Chapter 2 – This chapter was more focused on map design and details. So this incorporated those symbols and labels a lot more that we learned about in chapter 1. It also went into more detail on the maps and their features. This chapter also dealt more with the 3D mapping and showed how we can move the map around to look at it in different ways. This chapter also helped in learning how to create dot density diagrams within a map and other custom scales for visibility ranges.

Chapter 3 – This chapter was probably the most in detail with learning how to build maps and charts. This chapter had you start out with the maps that we worked on previously and you had to label them and everything and then you actually share the maps online and build a dashboard that you will do mapping work with. It goes into detail with labeling your dashboard with everything and you include the map, pie chart, table, and bar chart. All of which have the information you need for that specific map and dashboard in general. And you can see all the work on your content on ArcGIS.

Miller – Week 4

Chapter 1

I found this chapter to be the easiest by far. My biggest takeaway from Chapter 1 was the importance of the “contents” tab, and I quickly learned that most functions run through this feature. Another important feature was the “catalog” pane, through which many of the major functions are run. Finally, I realized the importance of using layers and raster layers in the contents pane, how to zoom in and out, as well as how to use attribute tables. Overall, the content in this chapter was pretty straightforward, and I only encountered minor issues when I didn’t read the directions closely enough.

Chapter 2

Chapter 2 was significantly more challenging than Chapter 1, but I found it to be equally as interesting and useful. Some things I found that seemed important were: adding labels and editing text, polygon symbols, and creating pop-ups. I also began to learn the importance of the Symbology pane, how to make a 3D visualization of a map, and how to make a density dot map. I found editing text to be difficult at first, especially adding holo to the edges of the text, but I got the hang of it with a little practice. 

Chapter 3

I found this chapter to be a little harder than Chapter 1, but easier than Chapter 2. Creating bar charts and line graphs was fairly easy, but I found formatting the graphs to the page to be somewhat difficult, especially adding guides to the page, which took me a minute to figure out. I had no problems sharing maps online and creating stories in StoryMaps. 

Dondero – Week 4

Chapter 1:

-After installing the software and downloading the tutorial files, I imported the first file and began completing the lessons.

-I learned how to go to a bookmark as well as turn on and off layers by selecting them in the contents page. 

-Switching basemaps allows you to overlay the data onto a variety of map backgrounds which can be useful for focusing on specific features.

-By Changing the layer order in the content pane, you can change which layers appear on top of which others

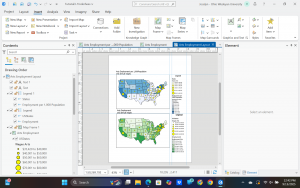
-You can create, save and export specific layouts for your maps in a variety of formats and settings.

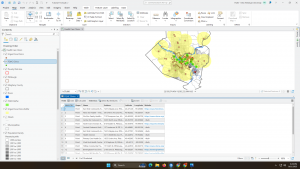
-You can see all the attributes for a data type by using the attributes table, and sort the table by ascending or descending values.

-You can select data using the attributes table and generate summaries using different statistical tools.

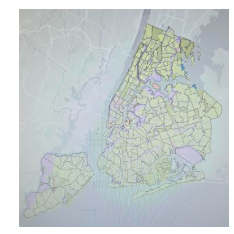
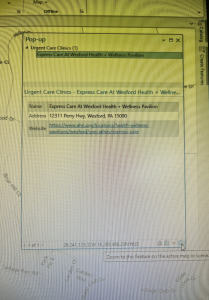
-I learned how to change and add symbols signifying the location of various data points, as well as how to label data points.

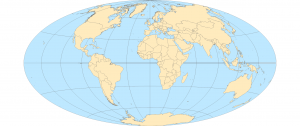
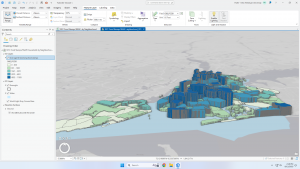
-I also learned how to view and navigate the 3D map projection, and how to switch between map types using the catalog pane.


Chapter 2:

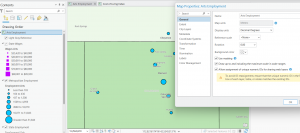
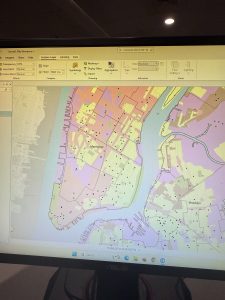
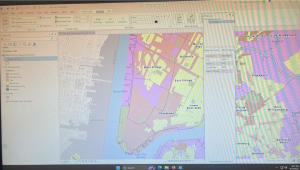
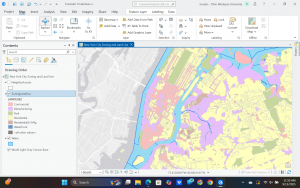
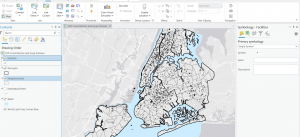
-I learned how to set the color and fill for various features, as well as how to set them based on specific attributes, such as zoning attribute

-By labeling specific features, you can add additional information, in conjunction with using fill colors and borders

-You can also remove these labels for certain features only, or remove those of them that are redundant. 

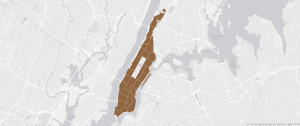
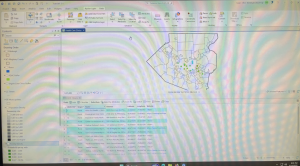
-By performing a search query, you can narrow down the range of a certain data set based on attribute, and using boolean operators add or reduce the selection using other attributes to select only the desired data.

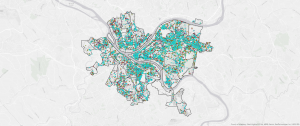
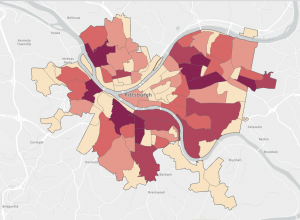
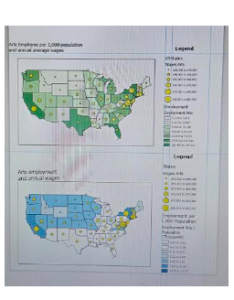
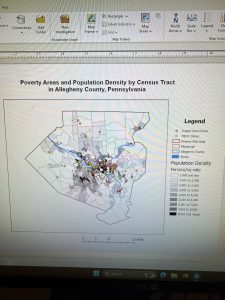
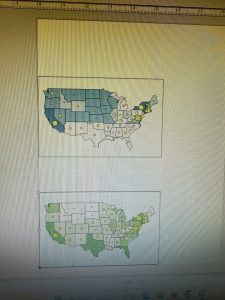
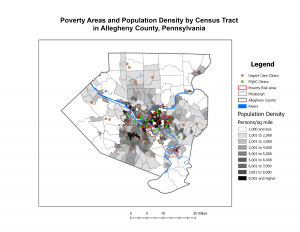
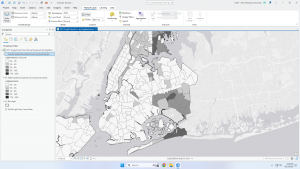
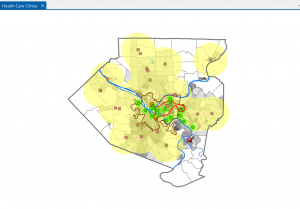
-I learned how to make choropleth maps to summarize numerical data and display the results as easier to understand heatmaps, as well as how to extrude them using the 3D view.

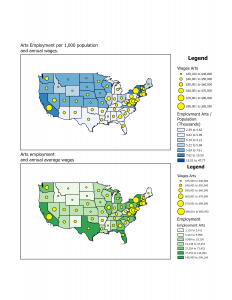
-Using graduated data points can help show the proportional differences in quantities or sizes between different features of the same type on a map.

-Choropleth maps can also be normalized by using percentages, which can more accurately display certain types of data, and by using dot density maps, multiple attributes can be displayed on one map at the same time, using different color dots for each attribute.

-Finally, visibility ranges can be useful for hiding certain features at different zoom amounts, and altering the detail level based on how much of the map is in view.

Chapter 3:

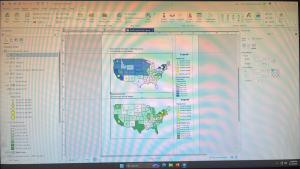
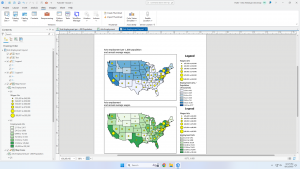
  • I learned how to create custom layouts that can be exported to be used in other softwares, or shown to non GIS users.
  • Many arrangements, sizes and styles exist for the layouts, and multiple maps, along with legends and other text can be combined in a single layout.
  • Various types of charts can be created as well, to illustrate trends in the data in ways that a map could not.
  • Maps can also be shared online to be viewed on a different device or by others.
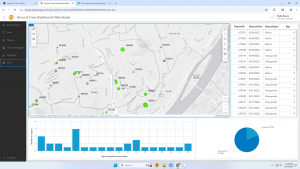
  • I learned about making interactive maps using the storymaps feature, and how you can create dashboards, which allows you to interact with the data in a predetermined way, and build toolkits for specific use cases. (Such as the city debris collection one from the tutorial.)

Inderhees- Week 4

Chapter 1

This was a good introduction for how to use GIS program. As this was my first time using a software like this, I found it very confusing at first. By time I got to the end of the chapter I was starting to understand how to work the program. The different layers and understanding how they all work was a key point I got from this chapter. The part I found the hardest was probably understanding the hard drive and how to transfer stuff in to start the tutorials.

Chapter 2

This chapter was cool due to how I learned how to kind of categorize things on the map based on what it is and make them different colors. I can make it so I can easily see the spatial differences in a map. This helped me to fully understand the importance of GIS and how it is truly used in the real world. I had a few difficulties with this and learned how to problem solve through the software. My computer kept saying error and so finding the problem and fixing it was a challenge.

Chapter 3

This chapter helped me to figure out how to share the information to an external source and make it understandable without having the GIS knowledge or software at your disposal. This chapter also went the quickest and was the easiest for me. I also struggled with this chapter a little bit as I used my personal laptop instead of the computer lab desktops which switching over, I had to relearn or figure some things out as they appear slightly different on my laptop.

Overall, these three chapters were a very good introduction to the GIS software, and I found it all very intriguing. The book does a very good job of explaining the process and breaking it down step by step.

Kozak Week 4

Week four was all about introducing the program by physically going through several tutorials on how to operate and understand it. I read the preface, chapter 1, chapter 2, and chapter 3 and did the corresponding tutorials with each section. 

Chapter 1:

Chapter one was the beginning of making/using maps on ArcGIS. This is the first time I have done anything like this so there was definitely a learning curve involved but overall this chapter was easy to follow along and understand. A few things this chapter focused on were base maps and layers, navigating the program/controls, attribute data, and symbolizing maps. I really like the format of this book because as someone who is completely new to this, it doesn’t feel overwhelming and everything is laid out in very simple steps.

Chapter 2:

The goal of chapter two is to learn how to design and symbolize thematic maps. It worked through choosing layers and using spatial context in your map. This chapter was a little more difficult for me as it had more content and started to become more complex but overall it was still easy to follow and laid out well. Things that were learned in this chapter included symbolizing qualitative attributes, labeling features and configuring pop ups, filtering with definition queries, creating choropleth maps for quantitative attributes, displaying data using graduated and proportional point symbols, normalizing population maps with custom scales, creating dot density maps, and setting visibility ranges. In section 2.8 I was having trouble with the visibility range and finding “Out Beyond” as an option where only min and max scale were there. This chapter was helpful in seeing how easy it is to read the maps once you understand what you are looking at/what they are representing.

Chapter 3: 

Chapter three focuses on sharing maps beyond ArcGIS users and with people who don’t have advanced GIS or mapping knowledge. This chapter was heavy on using elements in the ArcGIS online browser and showed how to use many of the available features. Things that were learned in this chapter include how to build layouts and charts, sharing maps online, creating a story in ArcGIS StoryMaps, and creating a dashboard in ArcGIS Dashboards. Overall, I thought this chapter was really helpful in showing how what we are learning can be used in real life.