Chapter 1
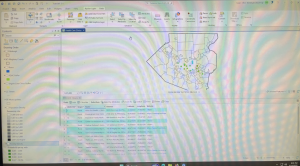
I found this chapter to be the easiest by far. My biggest takeaway from Chapter 1 was the importance of the “contents” tab, and I quickly learned that most functions run through this feature. Another important feature was the “catalog” pane, through which many of the major functions are run. Finally, I realized the importance of using layers and raster layers in the contents pane, how to zoom in and out, as well as how to use attribute tables. Overall, the content in this chapter was pretty straightforward, and I only encountered minor issues when I didn’t read the directions closely enough.
Chapter 2
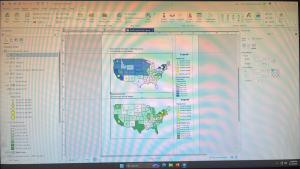
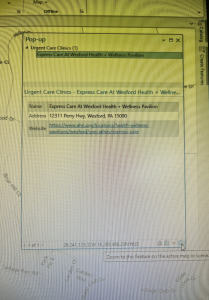
Chapter 2 was significantly more challenging than Chapter 1, but I found it to be equally as interesting and useful. Some things I found that seemed important were: adding labels and editing text, polygon symbols, and creating pop-ups. I also began to learn the importance of the Symbology pane, how to make a 3D visualization of a map, and how to make a density dot map. I found editing text to be difficult at first, especially adding holo to the edges of the text, but I got the hang of it with a little practice.
Chapter 3
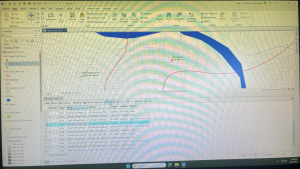
I found this chapter to be a little harder than Chapter 1, but easier than Chapter 2. Creating bar charts and line graphs was fairly easy, but I found formatting the graphs to the page to be somewhat difficult, especially adding guides to the page, which took me a minute to figure out. I had no problems sharing maps online and creating stories in StoryMaps.