Hi my name is Brendon Hess, I am a Sophomore this year and I am majoring in Biology.
I completed the week 1 quiz. After reading Schuurman Chapter 1, I realized how many applications to the real word GIS really has. Without even realizing it, I take for granted how complexly laid out our everyday lives really are. GIS has helped organize basically every part of our lives, the roads we drive to school, the sidewalks we walk, the building layouts and locations we have classes in, the most efficient ways from town to town, GIS is everywhere. One thing I found very interesting after reading this chapter was how the original GIS maps were hand drawn by cartographers! I mean can you imagine how many hours it takes to make one map? Then you need to make multiple by hand, so accurate that they can be laid on top of each other and a route for a road can be created! I found it very cool that that was someone’s job at one point and I can’t imagine the time comitment. Another thing that stuck out to me in this reading was the map on Cholera outbreaks in London in 1854. I thought this map was very interesting because of its significance in which time it was created. This map was made very early on in the storyline of GIS and it does a very good job at indicating that there could be a link between well water and catching a case of Cholera. The reading also brings up a good point that these maps can sometimes help the general public to better understand data. Sometimes its hard for people to collect what’s happening by just looking at a table, but if you have a map to go along with the table, then it may help people understand what’s going on. After reading this chapter I am looking forward to learning about all of the strange things that GIS can help us compare and predict based on overlaying data and maps.
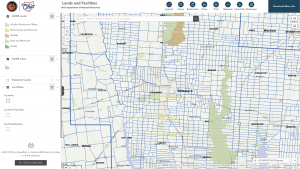
One possible application for GIS that I am interested in is the use of GIS to track animal populations. From what I found, it sounds like it can be used in many ways such as, monitoring movement and habitat use, and human-wildlife conflict and conservation planning by integrating spacial, ecological, and social data. After learning this, I think that the conservation biology applications are something that I am very interested in. Here is a photo from the Ohio Division of Natural Resources showing the use of GIS to show where forests, wildlife, and parks are in the Delaware area.
Another possible application for this technology is the mapping and tracking of marine wildlife. Because we know very little about our oceans, I think it would be cool to know where the fish are going during the different seasons and try to link it to a why. The why, could be a completely different GIS map that we could link it to, such as water temperature.
Sources:
Esri. “Lands and Facilities – ArcGIS Experience.” ArcGIS Experience by Esri, experience.arcgis.com/experience/cd0e442b17b14e16843447a5063997cd/page/Lands-and-Facilities-Main. Accessed [10, Sept., 2025].