Hi, my name is Hektor and I’m a senior (sort of) (returning after some time off) double majoring in Fine Arts and Environmental Studies. My art education here is mostly in jewelry/metals but we don’t have that now so I’m doing photography and crocheting on the side. As for the environment I’m interested in the social science of how culture leads us to impact the world, especially with our attitudes towards plants. I have an interest in invasive plants and what we define as “weeds” as well. I don’t have a good full body picture right now and I’m always changing up my hair and whatnot so I just have a selfie for now!
I took the quiz and it was fine, and then read the reading, which answered some of my questions and raised others. First of all I was confused as to how GIS even worked but the description of the pre-computer layered maps with tissue paper made it make more sense to me. Right off the bat the chapter mentions Starbucks using GIS and I have to imagine that most other companies with any kind of multiple locations would use it to track the most profitable locations as well, and controlling the flow of money is social control from monopolies (even, maybe especially from a coffee shop). I wonder how much the use of GIS for things like tracking property values, education, and crime is used to either uphold or fight against housing and education discrimination. One other thing I thought about a lot was the manipulation of data. You can have hard statistics that say one thing, but by organizing them a certain way in an infographic or a GIS layer you can make someone believe the opposite. Making data intuitive to people who don’t have a background in statistics can be a blessing or a curse if that data is manipulated by the wrong people. Another thing the chapter touched on were the two fundamental problems in science: some information is nearly impossible to make into quantitative data, and of course, no scientists can agree on anything. GIS begins to tackle the first problem in my opinion because by combining multiple layers of things like pollution, nature spaces, and health records, one could determine the overall health of a community in a more “human” way. Of course, if you have numbers to combine, you can make a numerical score to define that health that more people are likely to agree upon.
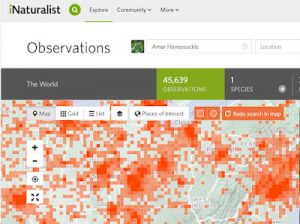
As I mentioned I’m interested in invasive plants and how they spread, and the density and spread of invasive plants is a good indicator of the overall health of a natural environment. I live in Columbus, which has a lot of urban forest spaces that unfortunately have a problem with several invasive species, especially honeysuckle. I grew up hanging out in the forests by the river, so I found an Inaturalist map of my neighborhood (because I also love the idea of crowdsourced spatial analysis) and an article about the spread of honeysuckle as well.
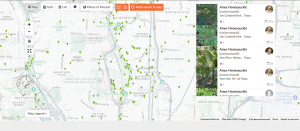
https://www.inaturalist.org/observations?place_id=any&subview=map&taxon_id=82342
Invasive Honeysuckles and Birds. (2023, November 28). Ohio Birds and Biodiversity. August 22, 2025, https://jimmccormac.blogspot.com/2023/11/invasive-honeysuckles-and-birds.html