My name is Megan Tooill and I am a junior. I am majoring in zoology, environmental science, and environmental studies, and I play softball here at OWU.

After taking the GEOG 291 quiz, I read Chapter 1. This chapter focused on introducing what GIS is by differentiating between GIScience and GISystems. It defines GISystems as an answer to “what” and “where” with practical applications, like mapping, spatial analysis, and data management. In contrast, GIScience is defined as an answer to “how,” specifically how do we know what we know and how to validate the information that has been displayed. With this differentiation, the chapter describes how GIS developed as an outcome of both social and technological developments, arising as the need for better data and visualization methods increased. Schuurman discusses how GIS initially emerged from military, government, and scientific needs, but it has since evolved into a versatile tool used widely in fields such as urban planning, environmental management, and public health. Its rise coincides with broader cultural trends toward visual data, digital decision-making, and the increasing reliance on technology to solve complex problems.
GIS increases accessibility to people and better communicates information because, according to recent studies, people tend to “reason” more effectively using imagery rather than numbers and texts alone. This highlights how maps not only display information but also actively influence decisions and shape perception. Schuurman challenges the common assumption that maps are neutral representations of space and claims that GIS is inherently ideological. Depending on how models are created, they can emphasize different aspects of a specific space. The creator of the model decides what information they want to portray and how to present it, a process known as ontology, which inevitably removes complete objectivity. This makes GIS a powerful tool, but also one that requires critical awareness of its limitations and biases.
One application of GIS that I found was for determining heterogeneity in disease distribution. In other words, how diseases vary and appear throughout a population. Using GIS can link disease processes and explanatory spatial variables to find ways to combat the spread of disease. A second application of GIS that I found designated critical habitats for endangered and threatened species. Using GIS helps create an image of what regions are in need of the most help and emphasizes the severity of problems associated with loss of biodiversity.
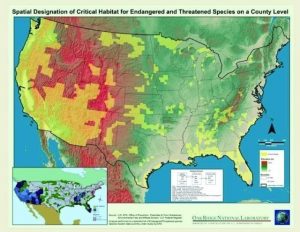
Fig. 1. Critical habitat areas for endangered and threatened species. Red depicts the most important areas to conserve, while green depicts areas that are of less concern.
Work cited:
FLETCHER-LARTEY, S. M., & CAPRARELLI, G. (2016). Application of GIS technology in Public Health: Successes and challenges. Parasitology, 143(4), 401–415. https://doi.org/10.1017/s0031182015001869
Sabesan, A. (2018, March 4). Aarthy Sabesan publishes article on spatially designating endangered and Threatened Species – BSC Group. BSC Group – Shaping New England’s future together. https://www.bscgroup.com/news/aarthy-sabesan-publishes-article-spatially-designating-endangered-threatened-species/