Hello. My name is Faith Fox, and I am a sophomore. I am majoring in Environmental Science and pre-law with a French minor.
After taking the syllabus quiz and reading chapter 1, I realized how GIS was viewed and how widely accepted it has become, and all the applications it has. Also, how often we look at maps and images that have been produced via GIS technology. I do agree with Waldo Tobler’s view that spatial analysis is a means to assist graphic representation, rather than an end in itself. It is important, especially in today’s environment, to incorporate and accept the use of technology. GIS incorporates ongoing research into geographical visuals. I understand the comparison of GIS to a “black box” in the sense that it is better established, it is simply assumed to be true and good. Because of this comparison, it leads me to the question of: “Can GIS users input their own biases into their inputs to shape the output in the way that they want?” And, if that is true, what exactly is stopping those users from continuing their patterns of behavior? While very similar, there is a clear difference between GIScience and GISystems. GIScience is described as the way that we are processing this information, while the GISystems are sort of the “why” of the entire process that is GIS. I did find the fact that GIS technology can be used to predict the effect of future events with visual spatial analysis very interesting. Such as the example of a city looking towards future urban growth based on multiple factors such as density, socioeconomic indicators, geographical constraints, road networks, and present land use. Through reading this chapter, I learned the difference between simply drawing out your data and using patterns, relationships, and trends within that data to create a map, or in other words, mapping vs. spatial analysis. Through reading this chapter, I realized how many different ways GIS can be used throughout multiple professional fields.
I’m very interested in the spread of different types of pollution throughout the United States and which regions of the US are affected by different types of pollution more than others. Using GIS to map pollution allows the public to see a visual representation of real time pollution data, which can allow them to track pollution levels in their areas. Mapping pollution can also highlight vulnerable communities and how they are more likely to receive the negative effects of pollution, which can raise awareness to those vulnerable communities.
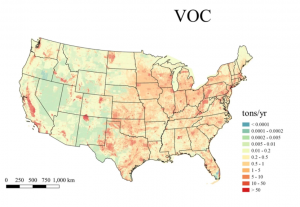
Figure 1: Map showing annual emission of volatile organic compounds across the US
Works Cited
Altaweel, Mark. “Mapping Air Pollution in the United States.” Geography Realm, 2023, https://www.geographyrealm.com/air-pollution-united-states/. Accessed 21 8 2025.
Mane, Suraj. “Leveraging GIS for Monitoring Air Quality and Pollution Levels.” Geographic Book, 2024, https://geographicbook.com/leveraging-gis-for-monitoring-air-quality-and-pollution-levels/. Accessed 21 8 2025.