O’Neill Week 5

Chapter 4 was about file geodatabases. I had no idea what these even were before (perhaps I wasn’t paying enough attention in GEOG 292), but now I get that they’re basically Esri’s way of organizing spatial data. I learned that you store all your feature classes, raster datasets, and other related files in a geodatabase. I guess it’s more efficient that way. The chapter showed how to import data into these geodatabases, modify tables (like adding and deleting columns – which I’m always a little nervous about, making sure I don’t delete something vital!), and even how to write little expressions to calculate fields. That was a cool connection back to some basic coding stuff. Joins were also covered, which is about linking tables together based on a common field. It’s like saying, “These two tables have a column in common, so stick them together!”

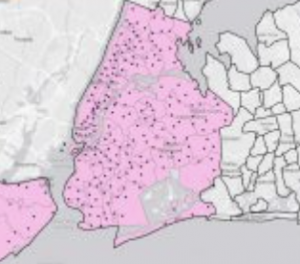
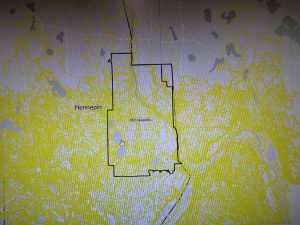
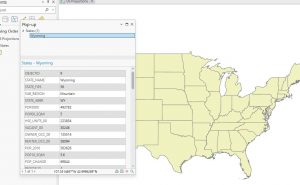
Chapter 5 was a lot. It was about different types of spatial data, and where to find them. It started with map projections, which are ways to show a round earth on a flat map. There are a bunch of different map projections for representing different things, all with trade offs, so you gotta choose the correct one. Then it went into projected coordinate systems, which are like grids laid over the map to make measuring distances easier. The chapter also talked about vector data formats (like shapefiles, which I’ve seen before) and, most importantly, where to get all this data. It turns out there are tons of sources, like the US Census Bureau. I never realized how much data the government collects and makes available. There was also a section on exploring sources of spatial data like ArcGIS Living Atlas.

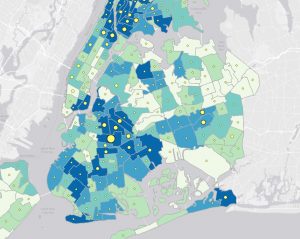
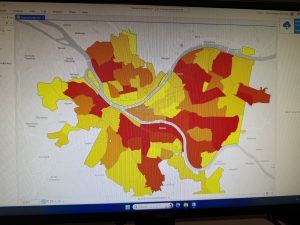
Chapter 6 was about doing stuff with data, which is where it gets fun (and sometimes frustrating!). It’s called “geoprocessing,” which is a fancy word for manipulating spatial data. The chapter covered a bunch of tools that let you extract parts of your data, combine layers, and do all sorts of useful things. One tool that stood out was “Dissolve,” which lets you merge polygons together based on a common attribute. For example if you have a map of city blocks, and you want to group them into neighborhoods – Dissolve can do that. Another tool was “Intersect,” which finds where features overlap. So, if you have streets and fire company zones, you can find which streets are covered by each company. I had a little trouble with some of the parameters, especially making sure I had the input and output layers right. Sometimes I felt like I was just clicking buttons and hoping for the best! But I eventually got it to work.

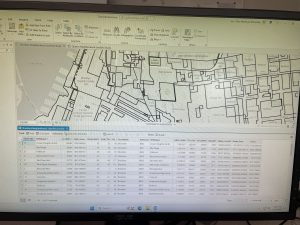
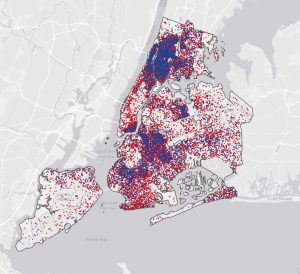
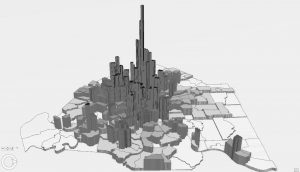
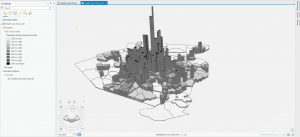
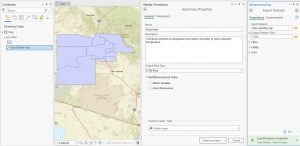
Chapter 7 was about creating your own spatial data, which is called “digitizing.” It’s basically tracing things on a map to create points, lines, or polygons. I was surprised at how much you could do with this. The chapter showed how to edit existing features, like moving buildings around or changing their shapes. You can even add and delete vertices (those little points that make up a polygon). There was also a section on using something called “procedural rules” to create 3D models, which looked really cool but also a bit intimidating. One thing that I got stuck on was the snapping. I kept forgetting to turn it on, and my lines weren’t connecting properly.


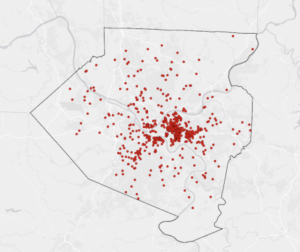
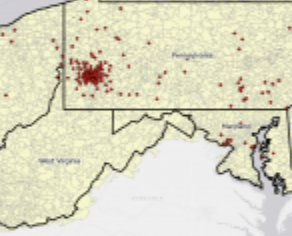
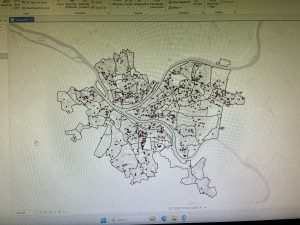
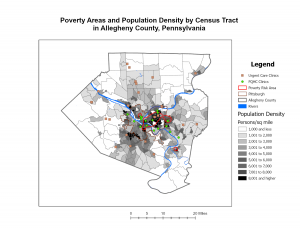
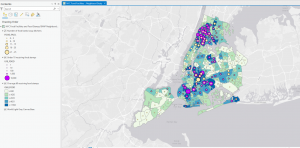
Chapter 8 was about geocoding, which is turning addresses into points on a map. It’s basically giving spatial context to location data. I learned that you need two things: a table with addresses (the “source table”) and a map with streets (the “reference data”). ArcGIS Pro then tries to match the addresses to the streets. The chapter went through the steps of building a “locator,” which is like a set of rules for geocoding. You have to tell it which fields in your table correspond to the address, city, state, and zip code. Then you run the geocoding tool, and it tries to find a match for each address. One thing that was emphasized was that geocoding is not perfect. It uses “fuzzy matching” because addresses can be messy (misspellings, abbreviations, etc.). So, you get a “match score” for each address, and you can set a threshold for what you consider a good match. I thought that was pretty smart, but it also means you have to double-check the results, especially if accuracy is super important.

Weber Week 5

Chapter 4: Working through Chapter 4 felt much smoother compared to earlier sections. Importing data wasn’t difficult, though it required a bit of patience. The process took some time, but I can see how repetition helps reinforce these skills. One of the biggest improvements I’ve noticed is my ability to navigate ArcGIS Pro more efficiently. I’m no longer spending extra time searching for tools like the Catalog Pane or the Toolbox—they’re becoming second nature. It’s rewarding to see how practice is translating into better workflow efficiency. While some steps felt a bit tedious, they’re definitely helping to build a solid foundation for more advanced tasks ahead.

Chapter 5: Chapter 5 was an eye-opener when it came to working with world map projections. I hadn’t realized just how many different ways a map could be projected, and it was fascinating to see how even at a continental scale, state shapes and sizes could shift depending on the projection used. It really put into perspective how map distortion works.This chapter definitely reinforced the importance of choosing the right projection and understanding how data interacts with spatial features.

Chapter 6: Chapter 6 focused on constructing a neighborhood map, which was an engaging and practical exercise. One of the highlights was working with fire department and police station layers—it was interesting to see how these essential services are mapped and analyzed within a community. Being able to visualize and manipulate these layers added a real-world element to the tutorial, making it more than just a technical exercise. This chapter reinforced how GIS is used for urban planning and public safety, which made the work feel especially relevant.

Chapter 7; Chapter 7 was by far the most interesting and enjoyable for me. I really liked working with the different tools to create maps—it felt both creative and practical. The hands-on experience made the concepts click in a way that previous chapters hadn’t. That said, I was left with some lingering questions. While I now know how to use these tools, I’m still wondering about the best scenarios for applying them. When should I choose one tool over another? What are the real-world implications of these choices?

Chapter 8:Chapter 8 was fairly straightforward. It felt very short and fast. In 8-1, I ran into a few minor hiccups when trying to locate certain buttons, but overall, it wasn’t too challenging. After a little searching, I was able to get everything working without too much trouble. 8-2 went even smoother—I didn’t encounter any major issues, and the steps felt intuitive. It was nice to have a chapter that flowed easily, reinforcing skills without too many obstacles.

Week 5 Siegenthaler

Chapter 4:

Chapter 4 started with a bit of confusion trying to find the catalog pane, but I eventually got the hang of it. The rest of the chapter focused on importing data, adding it to a geodatabase, and using it to make maps. I also learned how to modify attribute tables and filter data, which was really useful. The coding part was a bit tricky, but following the tutorial helped me through it.

Chapter 5:

Chapter 5 started off easy but got a bit more complicated. I learned about coordinate systems in ArcGIS and how to use them. Then, I worked with vector data and shapefiles. The section on census data was challenging, especially when I had to join two data tables to create a map, but I eventually figured it out.

Chapter 6:

Chapter 6 was about geoprocessing, and I learned how to dissolve features to create neighborhoods. I wasn’t sure what dissolving was at first, but it made sense after following the tutorial. The chapter was pretty straightforward, and I created a map that could be useful for emergency response teams.

Chapter 7:

In Chapter 7, I worked with polygons, learning how to split and trace them. The tutorials helped me get comfortable with managing features and using cartography tools. The final part showed me how to transform and export data, which was pretty useful.

Chapter 8:

Chapter 8 was about working with zip codes and geocoding street addresses. It felt a bit strange at first, but I can see how it’s helpful for mapping. It wasn’t as straightforward as the other chapters, but it was still interesting.

White Week 5

Chapter 4:
I thought chapter 4 went through pretty easily. I had to go through the book a lot because I wasn’t able to find several things but I in the end I did. There were times when I had errors but quickly fixed them.


Chapter 5:
I found Chapter 5 pretty cool, doing world map projections and comparing. I did have some trouble importing data for a little bit but ended up figuring it out. This chapter took me the longest just because something happened with the computer and I had to reload but overall, it was fine.

Chapter 6:
Chapter 6 gave me no issues. I enjoyed working with the fire departments.


Chapter 7:
Chapter 7 I liked using shapes. Also, this was probably my favorite map that I created I found it very cool.

Chapter 8:
Chapter 8 went well, I did not have any trouble. I found it cool working with all of the zipcodes.

Urton Week 5

Chapter 4:

Chapter 4 goes more in depth with working with databases which are basically just places where a collection of data is held for a certain topic. The first task in the tutorial was learning how to import data into ArcGis, putting a data table into a file geodatabase and then utilizing the database into the map. Then continuing on with tables the next part covered how to modify attribute tables and joining a data table with an attribute table. After this, it was a lot of in depth tasks of getting useful information from these tables like filtering the range of when certain crimes occur. Coding has come up a lot in this chapter which was very confusing to me since I know nothing about coding but for the most part if I followed the tutorial I was fine. Overall I feel like I’m starting to get the hang of things and this chapter went by pretty fast. 

Chapter 5:

Things started out pretty simple and easy to follow but I feel like as the chapter went on it took me a lot longer to find things and the tutorials have started to get less descriptive. To start out I learned about all of the coordinate systems that ArcGis has, where to view them and put them to use.I found this part pretty easy and the tutorial matched up well with the software and other websites I had to visit to gather more information from.  After this the tutorial goes over working with vector data, using conversion tools to import shapefiles into geodatabase so that they can be used on the map and converting other various file types. The next part got a bit more complicated with working in outside websites for the US census maps and data tables. For some reason section 5-5 took me too long and I had to do a lot of guessing and rereading to figure out how to get the end product and I struggled to join the 2 data tables together in the end to make the choropleth map. 

Chapter 6: 


Chapter 6 was all about geoprocessing which is basically a framework and set tool for processing geographic data. The purpose of this is to build study areas and perform various tasks. Firstly, I started out with dissolving features in Manhattan, New York to create neighborhoods. I didn’t really understand what dissolving really was but with a lot of these new things that I am learning with ArcGis, you kind of have to trust the process. The data from this section was then used to create a useful map in which emergency response teams can easily identify fire divisions and population. Overall though this chapter went by pretty fast and wasn’t too hard to do. 


Chapter 7:

This chapter was pretty straight forward and went over things like editing polygon features, transforming features and using cartography tool which I enjoyed doing.

Chapter 8:

For whatever reason this chapter was so frustrating and I really only got the first part done before everything just got so messed up I couldn’t figure out how to continue.


Yates Week 5

Chapter 4:

In this first tutorial, I had a bit of trouble finding the catalog pane. I found it eventually, but it took a lot of searching and head scratching. Other than that, this was a really good chapter for data additions and management. Tutorial 2 was also about data, but more so modifying and adjusting it for easier visualization. I especially appreciated learning how to work with the attribute table. Tutorial three taught me how to adjust selecting by attribute and how to save and modify selections to be more specific. Tutorial four was really easy. It showed me how to create a spatial join between features, which is useful for processing data with a relationship. Tutorial five taught me how to make a point layer, which is another way to see the relationship between an area and an occurrence. Finally, tutorial six taught me how to create a new attribute table and join data from other attributes tables to the new one.

Chapter 5:

The first tutorial taught me how to manipulate the world map and search by geographic coordinates. The second  tutorial was similar, but on a country scale, not a world-wide scale.  Tutorial three was similar to the others, but on an even smaller level. It also gave me some m0re practice adding and adjusting the symbology of data. Tutorial four taught me more about shape files and how to use them.  Tutorial five was a lot. I learned where to find things like census data and how to put them into Arc. Tutorial six taught me more about finding and inputting data from national sources, or from other public agencies. This is really useful for future endeavors.

Chapter 6:

The first tutorial taught me how to use the pairwise dissolve tool, which allows data to be shown in a more concise way.  Tutorial two was a refresher on specific selections, and how to extract and clip these selections.  Tutorial three was short and sweet, and showed me how to merge features into one attribute table. Tutorial four was also short, and taught me what the append tool did. This allows me to add new data directly to an attribute table. Tutorial five was a new way to work with the attribute table, through using the intersect and summary tools. It helps organize the data better. Tutorial six also taught me more about the attribute table, specifically how to use the union tool and the calculate geometry tool.  It also let me practice more with joining tables. Tutorial seven taught me how to use the tabulate intersection tool, which makes sure that across lines, the actual population remains.

Chapter 7:

The first tutorial taught me how to manipulate polygons on the map, which is incredibly useful for lining things up properly, making it easier to view and analyze structures. I also learned how to split a polygon into multiple parts. Tutorial two built on one, but teaching me how to create and delete polygons on the map. I also learned how to use the trace tool to create a study area. Tutorial three taught me how to use the cartography tools to do things like smooth polygons. The final tutorial taught me how to transform features, and how to add and export them as a CAD drawing.

Chapter 8:

The first tutorial of this chapter was a bit weird. It taught me how to locate zip codes and use that data. I can see why it would be helpful, but it’s still a but strange to me. The second tutorial was equally as strange to me, as it taught me how to geocode based on street addresses, rather than ZIP codes.

Project:

Fondran Week 4

Chapter 1

Finally being able to apply my knowledge to the actual program was very exciting. At first it was a little bit hard getting the hang of everything but the book was very spot on to the program. It was fun figuring out how to open and close different layers as well as being able to zoom in and out revealing different layers. There were so many tools used in this chapter but I was able to run through all these tutorials pretty seamlessly. I learned that patience is key when working on the software. Each step is very meaningful and if you miss one your result will not be correct or usable. I enjoyed the  “your turn” part because it really made me think and apply the knowledge rather than just reading and doing exactly what the book was telling me to do.

Chapter 2:

Chapter 2 was a little bit of a different story. This chapter took me more time than the first chapter and included steps that were more complex than the first. I think that the first chapter did a very good job at giving me a basic understanding and chapter 2 took it to the next level. The symbology tab was very daunting at first but I slowly started to get the hang of it. However, I was unable to change the symbology for “over age 60 using food stamps”. This was the first problem I ran into and I wasn’t sure exactly how I was going to fix it. Before completely freaking out, I went to the website and read some of my classmate’s posts. That’s when I found out that this was a collective problem and no one had an answer to fix it. Additionally, I could not find the out beyond button and checked posts for a possible answer. I used Henderson’s post as a guide to fix my problem. I followed their directions by going to visibility range> max/min> <current> in order to make the pop-ups appear. Overall this chapter was mostly easy to follow and I’m slowly getting the hang of performing these tasks much more easily then the first chapter.

Chapter 3:

Chapter 3 was definitely much harder than the first two chapters considering we had to learn how to share our post as well as make a dashboard. It was fun to be able to learn how to actually post our work to the online website as well as learning the process for how to publish a story/dashboard. This definitely took me a lot longer because I have never used this online ArcGis program. I felt like the first two chapters were more of a follow step by step with extra hints whereas in chapter 3 you had to apply the knowledge you already knew without much help from the book. I did run into one problem when trying to format my dashboard . I am not sure I added my table element correctly. I tried following the steps again in the book but could not quite figure it out. I think I would benefit from possibly starting over and practicing this again in the future . Hopefully, when I have to make another post I will better understand how to without any hiccups

.

Henderson week 5

Chapter 4: Tutorial 4-1 was about exporting features and I found it all to be fairly straight forward.  We also used a lot of the data from the gdb, which was cool to learn how to do. The second tutorial was about attribute tables. I learned how to delete columns, add fields using the fields view tool, and joining/combining data and how to calculate the sum of fields. This tutorial was easy and I had no problems with it. 4-3 was about queries and I struggled with it at first. It kept telling me that my queries weren’t valid but I moved on and came back to it and had no problem. It showed me how to do a number of different things with queries and I ended up using them in the following chapters. 4-4 was about spatial joins and was quick and easy. The fifth tutorial taught me how to use the Feature to Point tool to teach me how to create a point layer. This tutorial was also easy. 4-6 was helpful because it had two different “your turn” sections which allowed to test what I had learned. Overall chapter 4 was easy and helped with what I did in the next 4 chapters.

Chapter 5: 5-1 was about correcting distortions on world maps. Because it is such a large space, and because the earth obviously isn’t flat, distortions are created on maps. I was able to learn how to help eliminate those in the first tutorial which was helpful. 5-2 was short and easy as it only covered one thing. I learned how to set a projected coordinate system, which helped me with the next tutorial. The third tutorial was also about coordinate systems but it showed me how to add layers, change coordinate systems and change the projected system. 5-4 taught me how to use multiple different tools in GIS. I learned more about exporting features, creating new layers from data, and adding X,Y coordinates. This tutorial was very helpful because I continued to use the export features tool throughout the tutorials. The fifth tutorial had me download data from another website to implement into a map. This is definitely something I will need to use again in the future so I’m glad I learned it now. I also learned how to sort through data and join data together to a table. The last tutorial for this chapter was one that I had trouble with. I was able to extract by mask and add the new data but I was unable to download data from the public agency website because the layer it told me to download was no longer an option. Other than that this chapter went fairly smoothly and was very educational.

Chapter 6: Chapter 6 overall was the easiest chapter for me. I blew through it and had no issues. 6-1 was about dissolving fields in the attribute table and block groups. I felt very confident in this section because when I got to the “your turn” portion I was able to do what it said without looking back at the steps. 6-2 was about selecting and editing different layers. First I learned how to select by attribute and then by layer. I was also able to do this section easily without the steps. 6-3 was really short as it only went over one thing. It taught me how to merge feature classes into one. I did this with water and waterfront parks in NYC. 6-4 showed me how to append two different classes to an already existing larger class. This was similar to joing information except I added two to one larger one. 6-5 taught me how to use the Pairwise Intersect tool. This tool is helpful for putting data on streets/centerlines.  The summarize feature allowed me to create a new attribute table with summarized length. 6-6 started with the Union tool which created new layers with smaller polygons with popups. This is good for neighborhoods. Then i used the Calculate Geometry tool and made a new definition query. I also did different things with the attribute table which was helpful for the next two chapters. The last tutorial had me zoom to different fire companies to study the polygons and different information on each. The last thing I did was learn to use the Tabulate Intersection tool which helped sort information on the attribute table.  For the “your turn” section I used the summary statistic tool to find out the total number of disabled people which can be used for planning.

Chapter 7: 7-1 was all about using the move button. I moved buildings to line up with the basemap. For the second tutorial I continued to use the move tool but I also learned how to split and relabel things as well as trace the outline of something. 7-3 taught me how to make the harsh lines rounded for things like parks and bodies of water. The last section of chapter 7 was slightly more complicated. I added data to create a new layer and then moved it to a different section of the map. I couldn’t figure out how to turn on the different layers at first as there wasn’t a check mark next to them. Then I exported the features to a new feature class and deleted the original. That is when I rotated the building and moved it closer to the other parts of the map so that it wasn’t as large compared to in the photos.

Chapter 8: This chapter was very short, and I had no problems with it. 8-1 was about zip codes. I made geocode data by zipcode first and then rematched data by zipcode. I learned how to use new tools in this section which was interesting. The second tutorial taught me how to use the create locator tool and then match data. I also used the geocode addresses tool again and learned how to select minimum candidates and create matching scores.

Kocel, Week 4

Chapter 1 

Getting started was a challenge for me. This was more time consuming than I thought, especially since I had trouble from the beginning opening the files. Once I got started it was relatively easy to get the hang of. Tutorial 1-3 was a bit more challenging, I had issues finding the attribute tables, then my entire computer froze and had to redo all of 1-3.

This is from the end of chapter one. This Chapter was about changing symbols of feature classes like the color and size. This screenshot of the 3D map is an interesting way to see the difference in population density in a city. It was fun to play around with. Chapter one helped me get familiar with the system.

Chapter 2

Chapter 2 is about designing and symbolizing thematic maps. This chapter was a lot more in depth than the previous chapter, so was a little bit more challenging.  For some reason, tutorials 2-2 and 2-3 were particularly frustrating. I could not figure out the labeling part of the section.  However it was satisfying to complete once I got the hang of it. I could not figure out how to get the 3D map in 2-4 to work, so unfortunately had to skip that part.  I will be coming back to it at some point though because I think it will be useful to know how to do that in the future. The image below is from tutorial 2-5 and is about displaying data using point symbols in the center in each polygon. Even though the purple is very vibrant and probably not the best shade for this map, I like the colors I chose. 


Chapter 3

This has been my favorite chapter so far as it was easiest for me to understand. This chapter was about sharing the maps created with people who don’t have ArcGIS. I really liked making the story on the website. The image below is from the first part of chapter 2 where I made a layout of the two maps in a way to make it easier to read for someone unfamiliar with GIS. I think that it is very important to know how to share the maps online, and I like how this section got me familiar with the web GIS and how to connect the two. I didn’t  know that the two would be as compatible as they are. 

Jolliff Week 4

Wowza, I didn’t think that following along in tutorials could be so time consuming and difficult. I do however think that I  was able to understand what I read during weeks 1-3 . This being said I realize now that you should start the weekly assignment in advance so that you aren’t cramming assignments because spending 5 hours in the GIS lab in one day is not it.

Chapter 1

Chapter 1 was a good intro into layers and kind of the basics of how to use Arc GIS. I thought that this chapter helped me to piece together some things from the reading. I was grateful for the tutorials and the step by step instructions. I especially was thankful for the hints. Once I got through chapter 1 I felt like I kind of had an idea of where things were and how to save my projects and name them. Honestly, I think figuring out how to download the tutorials was the hardest part for me. But, we managed and got through it.

Chapter 2

Chapter two gave me an idea of how to apply some of the things I learned in chapter 1. These tutorials walked me through how to make a map look like a map someone could use. I learned how to add labels and features. For tutorial 2-4 there was a red “!” next to Neighborhoods so I Couldn’t make the graph or anything for that section, it kept saying that there was no data, I tried reopening the tutorial but it didn’t fix the issue. Because of this I wasn’t able to complete 2-4 but I continued and got the chapter done.

Chapter 3

Chapter three was wild I handled 3-1 well, Building layouts and charts was a breeze but for some reason I had a difficult time figuring out how to share my map online. I managed to get to the part where you get to the MapSharing.pdf but the pdf was blank there was no text any where and often times no matter which browser I used it told me I was unable to see the pdf. This unfortunately hindered me from completing 3-2 and 3-4 . So I need to figure that out but I think once I do, it won’t be that hard.