Chapter 9:
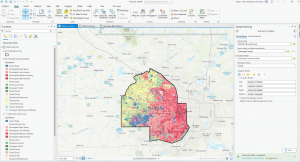
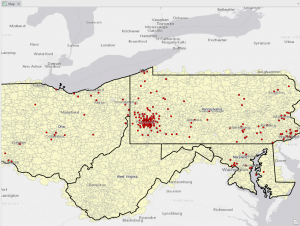
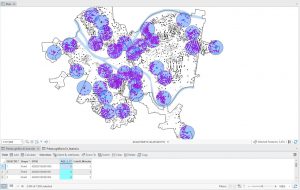
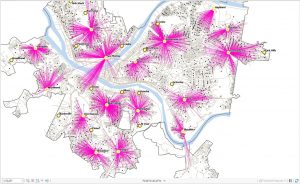
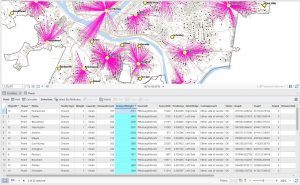
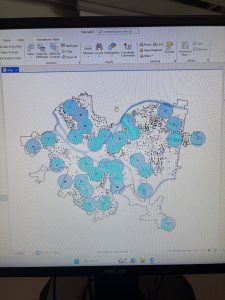
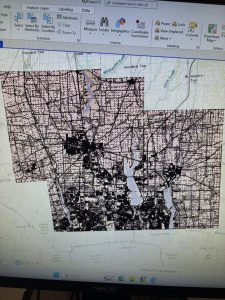
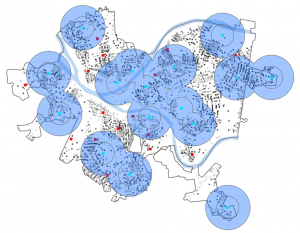
Tutorial one taught me how to use the pairwise buffer tool to find select attributes around an area. Tutorial two expanded on this by teaching me how to use the multiple-ring buffer tool, which creates layers of rings around a point. Tutorial three taught me how to use these buffer tools to create a service area around a space. Tutorial four taught me how to use network analysis to visualize the demand relationships between places. Tutorial five taught me how to perform a cluster analysis using the multivariate clustering tool.
Chapter 10:
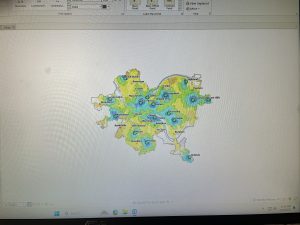
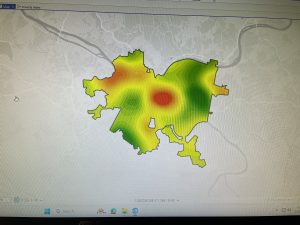
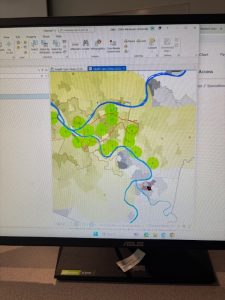
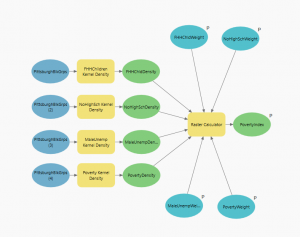
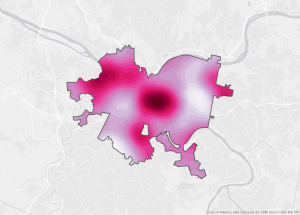
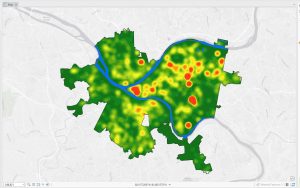
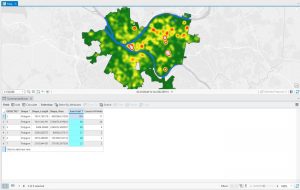
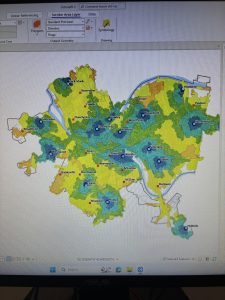
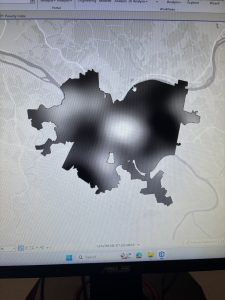
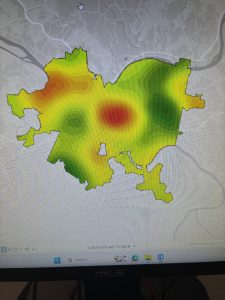
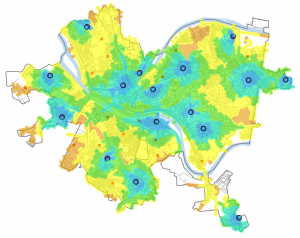
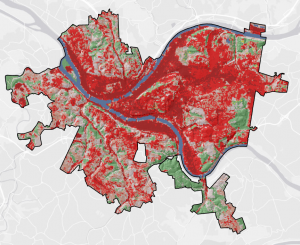
Tutorial one was really enlightening. It taught me more about how to use and manipulate raster data, which is really useful for remote sensing. Tutorial two taught me how to create a kernel density map, which is a useful way to visualize statistic data spatially. Tutorial three builds on this by teaching me how to use a kernel density index to create a risk model.
Chapter 11:
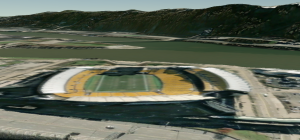
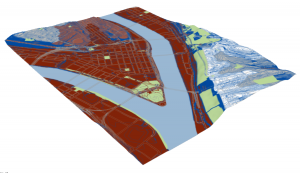
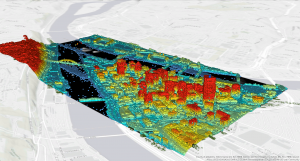
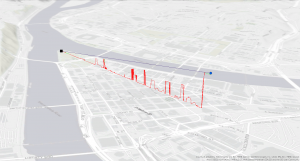
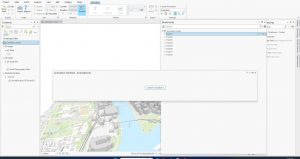
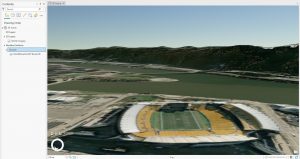
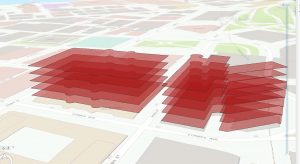
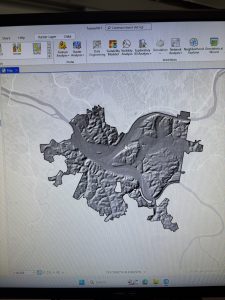
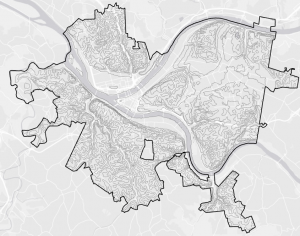
The first tutorial taught me how to explore a global scene, which is a map with elevation. It also taught me how to apply shading to more accurately depict certain times of day, which was cool. Tutorial two taught me how to work with a TIN, which we just started talking about in remote sensing. Tutorial three taught me how to create z-enabling features, which lets you visualize things like trees. Tutorial four taught me how to use lidar data to generate different types of raster and determine elevations. Tutorial five taught me more about navigating and working with 3D features in arc. Tutorial 6 taught me how to use procedural rules to visualize buildings, and how to visualize multi patch models. Finally, tutorial seven taught me how to create an animation, which was something I didn’t even know Arc could do.