CHAPTER 1
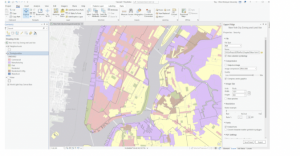
This chapter covered the basics of ArcGIS, emphasizing how to change basemaps, add features, and manage map layers. One key insight was the significance of selecting an appropriate basemap to provide meaningful context for spatial data. As I navigated through the software, I practiced zooming, panning, and adjusting layers to highlight essential details while minimizing unnecessary clutter. Accessing and utilizing the attribute table proved particularly beneficial, as it enabled efficient filtering and sorting of data, making it easier to identify trends such as regions with high population density. Additionally, I explored methods for customizing map symbols, including modifying colors, shapes, and labels to enhance readability. A standout feature was the introduction of the 3D view, which offered a fresh perspective on spatial relationships and added depth to visualizations. Although I encountered occasional difficulties, such as software crashes and missing tools, the overall experience strengthened my confidence in using ArcGIS for fundamental data visualization and organization.

CHAPTER 2
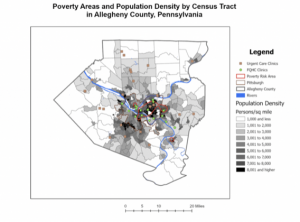
Building upon the previous chapter, this section delved deeper into refining map symbology and optimizing data presentation. I practiced adjusting colors, shapes, and symbols to create clearer distinctions between different data layers, improving overall map readability. Configuring labels and pop-ups made the maps more interactive by displaying key details, such as place names and statistical information, upon user interaction. Additionally, I experimented with definition queries, which allowed me to filter and display only specific data that met predefined conditions. This helped streamline the map’s appearance, ensuring that only the most relevant information was visible. I also explored different classification methods, including quantile and defined intervals, to better represent data distributions. Another valuable skill I developed was importing and modifying symbology for comparative analysis, such as examining income levels in relation to population density. Creating dot density maps further enhanced my ability to represent quantities visually, and learning to control label visibility at different zoom levels helped maintain a clean and uncluttered map layout.

CHAPTER 3
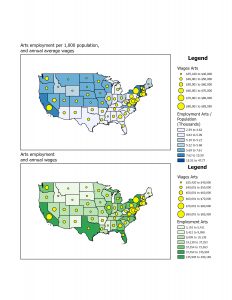
This chapter introduced more advanced ArcGIS tools, such as side-by-side map comparisons, map publishing, and interactive dashboards. Being able to compare multiple datasets within the same view was especially useful for identifying spatial relationships, such as the connection between population density and infrastructure placement. Another key takeaway was learning how to publish maps, which makes sharing data easier while maintaining control over visibility settings—an essential feature for presentations and collaborative projects. One of the most practical skills I developed was creating dashboards, which integrate charts, graphs, and maps into an interactive display. Dashboards are particularly useful for tracking real-time data and presenting findings in a clear, visually engaging format. Despite encountering some technical setbacks, such as missing legends and occasional glitches, this chapter significantly enhanced my ability to manage, analyze, and present geospatial data. I now feel more equipped to apply these ArcGIS tools in future projects and research.
