Chapter 1
I was pleasantly surprised by how straight forward the tutorials are. However, it was a struggle for me to begin going through with them. I had a few problems with my hard drive before I could even get started. It is USB-C only, which requires a port that is not on the computers. So I got an adapter assuming that it would work as it has in the past. This was in fact not the case. The adapter allowed the computer to recognize that the hard drive was connected, however it was not accessible on the computer. I then had to get a USB hard drive to start the work. Once I had begun I immediately started to enjoy the process of learning the software. I have taught myself programs such as Adobe After Effects, Sony Vegas Pro, and Final Cut Pro in the past, but those were all essentially me going through the programs randomly under the guise that “you won’t break it.” This was a much smoother and enjoyable experience by miles. I did not have any issues going through the motions of the tutorials from this chapter aside from one specific instance. In Tutorial 1-3, when obtaining summary statistics I had initially gotten the wrong value for the Mean (3174.1) rather than that of what was given in the textbook (4516.6). All other of the statistical values were correct. I ran the Summary Statistics tool for a second time and I was given the correct values for all of the Statistic Types. I honestly don’t know what happened the first time. I found myself getting comfortable navigating through the different windows of ArcGIS very quickly.
Chapter 2
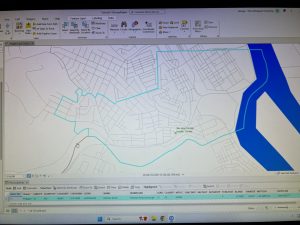
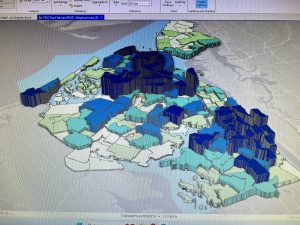
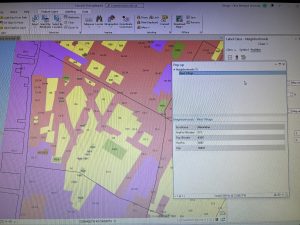
Getting into the second chapter of the textbook, I had to use a little more brain power to complete the tutorials. I was still having a pretty easy time completing the tutorials, however there were more instances in this chapter where I had to reread the instructions to understand what the actions I had to complete were, rather than just going through the motions. I had made very minor mistakes throughout these tutorials. One example of a mistake I made was when creating the definition query (Tutorial 2-3) I had missed that the program automatically set the ‘OR/AND’ option to AND, preventing the facilities from showing up on the map. However I quickly was able to troubleshoot what I did wrong and successfully create the query. After this, the next problem I ran into was directly after in Tutorial 2-4. When I opened the project the “Neighborhoods” feature had an exclamation mark next to it. When I moved into the Symbology pane I was greeted by a lovely message telling me that the “Neighborhoods” layer did not have a valid data source. I troubleshooted in the program before Googling my issue to see if anyone else had run into this. Luckily for me there was a posting on the Esri website from someone with my exact issue. They had solved it by dragging the Neighborhoods feature class from the catalog pane into the contents pane. After this I deleted the original useless “Neighborhoods” feature. From here it was smooth sailing for me in Tutorial 2-4. The next issue I ran into was in Tutorial 2-6. When importing the symbology to use the swipe to compare feature I missed a step. I forgot to set the Target Field to U18MHHFOOD. Due to me forgetting to set this field correctly the swipe feature did not work. After importing the symbology again, I realized my mistake and corrected it. After this the swipe feature worked perfectly for me. Overall I thoroughly enjoyed Chapter two of the tutorials. They were challenging enough in comparison to Chapter 1, however they were not overwhelming in the slightest.
Chapter 3
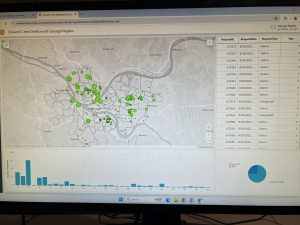
Chapter 3 started off okay for me. The first few steps of Tutorial 3-1 went smoothly. This was until I reached the point where you create and insert a chart. I was able to open Chart Properties and enter the data that was provided for me. However, when the instructions begin to refer to the chart being on the screen (Adjust the size of the map pane so that the bars on the chart are at the height you prefer) I cannot see the chart. After searching throughout the different tabs, I was able to insert the chart. However, this is not the completed chart, as I need to select the top 10 states for the chart to reflect the information the tutorial intends it too. After a very prolonged and unnecessary moment of frustration, I remembered to try and restart the software. After I restarted the software and opened the project, the chart appeared exactly where it should have been all along. Tutorial 3-3 was surprisingly challenging for me. I think that because I am used to using modern forms of social media that I assume I can use any website. While this is almost always true, I am not a natural at blog post style websites. However, once I got the hang of the phrasing the book was using it was smooth sailing. Tutorial 3-4 was very enjoyable. It wasn’t perfect as I am obviously still learning, however I enjoyed utilizing the different elements on the dashboard and incorporating them. As I had gotten the hang (generally) of how the usability of this website works in the previous tutorial I could just complete the tutorial without fighting with the website.