Chapter 1: I began by successfully signing into my account on ArcGIS in SCSC 207. Then, after downloading the necessary files, I was still unable to access the proper data in the program, so I began running an update to the ArcGIS software on the desktop. This took a significant amount of time so I then attempted to switch computers. I was in the lab for over an hour and could not manage to get the map to open properly or display any of the data. Eventually, I was able to get it to show up but, I am honestly unsure what we did that got the program to actually display the data. In the first tutorial I learned how the general program works, saving my project, and using a few different tools. The next tutorial taught me how to make a bookmark, zoom, change my layers, and select an attribute. In the third tutorial, I continued to use the attribute tables. I learned how to manipulate the data stored in these tables and change the view available within them. I also learned why manipulating this data may be useful in the context of census data. I did encounter an error message that I did not understand when trying to save my changes to the municipalities attribute table, but I do not think it will significantly impact the rest of the tutorial. I also learned how to find the summarized statistics for data used in my map. In the final module, I learned how to add more feature planes to my layers.

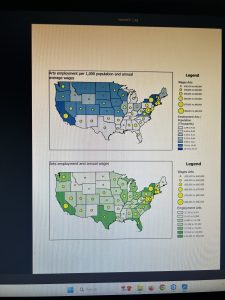
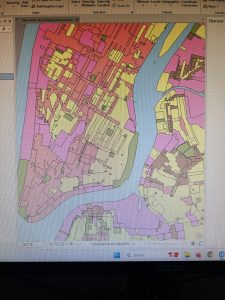
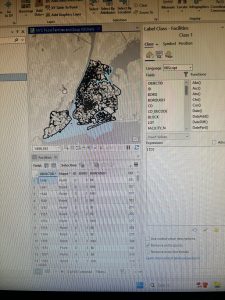
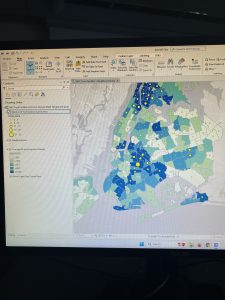
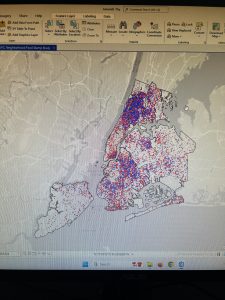
Chapter 2: The first tutorial helped me learn to change the colors of different areas in a map, in this case based on land use. The following tutorial gave me the skills necessary to label these areas and assign pop-ups within them with additional data. The third combined these to help me manipulate the symbols used for different types of assistance organizations and manipulate the map to better find these places in Manhattan. Unfortunately, I was unable to complete most of the fourth tutorial because there was an error with the tutorial data, and the file did not contain the neighborhoods data that was necessary to complete the work. I did read this tutorial so that I now understand more about how to create a 3D map in the program and how to manipulate the view of this map to get the proper visualization of the data. For the fifth tutorial it was really interesting to see how symbols can be used to better visualize and compare data within the map by comparing the food insecurity of the two groups overlaid as differently sized circles in their residential areas. Tutorial 6 was very interesting because I learned how to assign graduated colors to values in the program, and how to duplicate this on another data set and compare the two easily. Tutorial seven was helpful in understanding the dot density plots that were discussed in the reading section from last week because I hadn’t really read too much about or used that type of map before so it was really interesting to get to make one and look at how the data appears. For the 8th tutorial, the notes about labeling and zoom were helpful, however, I could not locate an “out beyond” button in the visibility range group which made it difficult to take all the necessary steps for this tutorial.
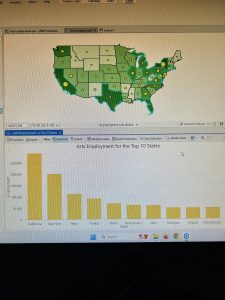
Chapter 3: In the first tutorial I am learning to make a layout using maps that were created in the GIS program. Unfortunately, I ran into an issue with the renaming of my layout so it is just called layout, but I will try again next time on the naming issue. Learning how to add the maps to the layout, resize them, and move them around is nice to know how to do when thinking about the practical uses for GIS knowledge and creating figures from data in the future to use in real life. It was also good to have the knowledge of creating a bar graph from the data and turning it into a graphic which will be useful in the future if/when I ever need to use data from GIS in a figure for research purposes. Unfortunately, due to the delays I had with my technically difficulties in getting started this week, this was as far as I was able to make it in the tutorials, I will begin with 3.2 next week and I intend to start earlier to accommodate for the extra workload I am putting on myself next week and to allow for anything else that may go wrong in the future.