Fry Week 1

I’m Izzy Fry! I am a Freshman Environmental Science and Zoology major, and I’m on the field hockey team. I’m from Dublin, OH.

It’s really cool to learn about all the applications of GIS because I didn’t know it had so many uses in various fields. I also did not know that the technology and concepts were developed in the 1960s. It is also interesting to learn that in the early days manual maps were preferred for the process of overlaying information even into more modern times. It was really interesting to get a little bit of a window into the history of cartography while learning about GIS. I had also not thought much about how the availability data and scale of a GIS based project can impact what is actually able to be produced. It was also very interesting to learn about how GIS can be used in terms of public health, specifically in the example of a cholera outbreak and locating the cause. Additionally, agricultural uses for GIS are very interesting because of the possibility of considering so many variables together. I’m excited to learn more about the possibilities of GIS.

I learned that GIS can be used in zoology for a variety of projects including gaging habitat suitability. This particular map is from “Modeling habitat suitability for endemic Grizzled leaf monkey (Presbytis comata) using geospatial machine learning approach” performed in Indonesia in 2022, by a team of researchers. This is very interesting because without GIS technology it would be very difficult to visualize this data especially in a comparative manner.

I also learned GIS can be used for resources that are important to humans including water quality. This map is from “GIS Mapping for Distribution of Ground Water
Quality in Udaipur” also performed in 2022. Which is interesting in terms of global health, public safety, and animal habitats.

O’Neill Week 1

Hey, my name is Adam, I’m a freshman majoring in Neuroscience(maybe) and Pre-med(maybe). I love to read and my girlfriend. I took 292 last semester so I’m taking the courses in reverse!

Schuurman’s introduction is primarily concerning the history and applications of GIS. The former half, history, was so so so boring to me because I don’t really care about how GIS came to be. Regardless, I did learn some new terms that I find worth mentioning. First, it’s worth mentioning that GIS can stand for two different things: “Geographic Information Science” and “Geographic Information Systems.” To me, it seems that these terms can be used interchangeably, but it can be helpful to differentiate between the two. GISystems generally refers to the hardware and software that is used to represent geographic data, while GIScience refers to the study of how the systems work, are used, and impact society. The latter half was a bit more interesting to me. It was an interesting exploration of how pervasive GIS is in so many fields. In health fields, for example, we can use GIS to model the spread of diseases or analyze the access communities have to care.

Searches:

Search 1: First, because I like reading, I decided to look up “GIS libraries” and stumbled across an article by American Libraries Magazine. The article details how librarians are increasingly using GIS to enhance their services and provide resources. It speaks to how librarians have created digestible interactive maps to make complex information easier to understand for readers.

https://americanlibrariesmagazine.org/2021/09/01/on-the-map-gis-software/

Search 2: In my second search, I decided to go in the direction of its use in disease control and awareness. I came across the World Health Organization’s website and found some of their data on COVID-19. On this page, there is a map that shows reported cases of COVID-19 globally.

https://data.who.int/dashboards/covid19/cases?n=c

Weber Week 1

My name is Trey Weber. I am a Junior on the Lacrosse team here. I’m a Finance major and I’m minoring in Economics. I am from Denver, Colorado. In my free time I like to ski and work on cars with my dad. 

Chapter 1 of Nadine Schuurman’s GIS: A Short Introduction introduces Geographic Information Systems (GIS) in a straightforward and relatable way. She explains that GIS is more than just software for creating maps; it’s a powerful tool for analyzing and understanding spatial data. From city planning to tracking environmental changes, GIS plays a role in solving everyday problems and answering big questions about the world around us. Schuurman gives a brief history of GIS, explaining that it emerged in the 1960s in different parts of the world. This simultaneous development shows how widespread the need was for tools to manage and analyze spatial information. She also highlights the difference between mapping and spatial analysis. While mapping visualizes existing data, spatial analysis uncovers new insights by examining patterns and relationships within that data. For example, mapping might show where hospitals are located, but spatial analysis can reveal gaps in healthcare coverage. A key takeaway from the chapter is the distinction between GISystems and GIScience. GISystems are the tools and software, like ArcGIS or Google Maps, while GIScience is the theory and research that guide how those tools are used. This distinction helps readers understand that GIS isn’t just technology, it’s a way of thinking and solving problems. Another important point is how data representation in GIS impacts understanding. Choosing symbols, colors, or map designs can influence how people interpret the information. Schuurman stresses the importance of clear and standardized design to avoid confusion. In summary, Schuurman’s first chapter lays the foundation for understanding GIS as both a practical tool and a scientific approach. It’s a great introduction that shows how GIS can help us navigate and make sense of the complex and interconnected world we live in.

My first search was “crime gis applications”. Here I found crime info for the city of Denver. It breaks down the type and location of certain crimes around the city. This gives an idea of what areas may be dangerous or have lots of theft. This can help people to plan where they may want to live. It also can be used by law enforcement to survey different areas and allocate officers strategically. 

Source: https://www.arcgis.com/apps/dashboards/17dcc405627742ad8f48988310b5a4d0 

My second search was “wolf telemetry gis applications”. I found that wolves are key to keeping ecosystems balanced. With GPS collars and GIS (Geographic Information Systems), scientists are uncovering the secrets of wolf behavior and movement like never before. GPS collars show where wolves roam, helping identify migration routes and hunting areas. GIS maps reveal what wolves need to thrive, guiding conservation efforts. Also, by mapping wolf activity near human areas, we can predict and prevent problems. GIS helps outline pack territories, revealing how wolves interact and share space among each other.

Keckler Week 1

Hello! My name is Emily Keckler. I am from Marengo, Ohio and this is my first year at OWU. My major is Environmental Studies, but I am considering a double-major with Geography. As a fun fact about me, I love cats and eating my vegetables!

The use of GIS under real-life circumstances is an interdisciplinary tool that can range throughout different subjects depending on the goals of the user. The tool can be used in multiple different ways and is changing alongside technological developments. However, the initial rise of GIS was underscored as making maps on computers instead of realizing the technological potential of analysis using GIS data. It is very fascinating to read how GIS was being developed in many different areas leading to the proliferation of Environmental Research Systems Inc (ESRI) which has a stronghold on GIS technology- even today. I do wonder, though, about the apparent contention behind the initialization of GIS; it seems like it would drain a lot of energy to debate on its roots when GIS clearly has roots in multiple areas. Why argue about something so menial in the grand scheme of GIS? 

I also found the point about what the acronym “GIS” means to be particularly interesting. Some like GIS to be “Geographic Information Science” instead of “Systems” and vice versa. The differentiation seems arbitrary in that GIS- however it is defined- can be used in both ways that it is identified. Reading on, the lines between “science” and “systems” concerning GIS seemed to rapidly blur. It began to seem less like a meaningful differentiation and more like a power imbalance among what the technology is used for. It was also very comical that the section recognized the muddiness of the subject. Regardless, it seems that either “field” so-to-say can be employed to serve the role poorly distinguished through “GIScience” or “GISystems.”

Whichever way that it can be defined, GIS is critical to many functions in modern living. From transporting food from farms to grocery stores to delivering an Amazon package in two days, GIS can be used for almost anything.

As an application area I looked up “Vegetable Garden GIS Applications” on Google Scholar where I found an assessment of the possibility for the rooftops of Boston, Massachusetts to be used for agriculture (Saha, et al. 2017). Using geospatial technology, researchers mapped out the numerous rooftops of Boston to determine their viability to be made into green space for produce yields, carbon sequestration, etc. (Saha, et al. 2017).

https://doi.org/10.1016/j.landurbplan.2017.04.015

For a second application I searched “Banana Farm GIS Applications” and this led me to an article from the Agrarian University of Ecuador concerning using GIS to optimize the process of fertilizing banana crops for nutrition standards (Duque, 2022). The use of GIS in this process allows for accurate control and monitoring of banana crops, soil quality, pest control, etc. (Duque, 2022)

Optimización de la fertilización del cultivo de banano mediante el uso de herramientas SIG | Centrosur Agraria

Counahan Week 1

My name is Colin Counahan. I am a Junior on the Lacrosse team. I am from the greater Columbus area. I am majoring in Education Studies and am minoring in Communications, Religion, and History. In my free time, I enjoy traveling and playing golf.

The first chapter of Nadine Schuurman’s GIS: A Short Introduction gives an insightful overview of Geographic Information Systems (GIS) and their impact on various fields. It begins by highlighting how GIS has become essential in modern life, influencing industries such as navigation, urban planning, healthcare, and even retail. Despite its wide use, many people remain unaware of how GIS shapes their daily lives.One key takeaway is how GIS is more than just mapping software. It combines spatial analysis with computer science, enabling users to visualize and interpret complex data. The chapter discusses the historical development of GIS, noting its roots in cartography and its evolution through technological advancements. I found it fascinating how early GIS methods relied on physical overlays of maps, a technique that later inspired computerized systems. It shows how simple ideas can lead to groundbreaking technology. A particularly interesting point is GIS’s identity crisis. It can mean different things to different people—a tool for city planners to map zones or a philosophical framework for researchers to analyze spatial data. This versatility is a strength, but it also makes GIS challenging to define. The author does a great job of explaining how GIS bridges quantitative methods with intuitive visualizations, making data more accessible and impactful. What stood out most was the emphasis on visualization. Maps and graphs are not just tools; they’re powerful ways to uncover patterns and tell stories. The example of Dr. John Snow’s cholera map in 1854 demonstrates how visualization can solve real-world problems.Overall, the chapter effectively conveys the importance and complexity of GIS while raising thoughtful questions about its societal and ethical implications. It made me think about how technology influences our perception of the world and how critical it is to use it responsibly.

#1: My search was “wolf telemetry GIS applications”


I found an example of GIS applications in wildlife management through the study of Yellowstone wolf pack territories. This map, titled “2021 Yellowstone Wolf Pack Territories,” represents the spatial distribution of wolf packs using aerial location data. The map highlights several wolf pack territories, such as Wapiti Lake, Mollies, and Junction Butte. GIS is vital for tracking these packs, helping researchers understand their movement patterns, territory size, and interactions with prey and other wildlife. This information informs management strategies to maintain a healthy balance within Yellowstone’s ecosystem, as wolves are keystone predators.This GIS application also benefits park visitors and staff by identifying areas where wolf activity is prominent, aiding in both educational outreach and safety measures.

Source: National Park Service, Yellowstone Wolf Project Report

#2 Crime patterns in Cleveland

I found an example of GIS applications in urban safety management through the study of crime patterns in Cleveland, Ohio. This map, titled “Cleveland Crime Density Map,” represents the spatial distribution of crime rates across various neighborhoods. The map highlights areas with higher concentrations of criminal activity, such as Downtown, Glenville, and Clark-Fulton. GIS is vital for tracking crime incidents, helping law enforcement agencies understand where resources are most needed and enabling them to allocate patrols more effectively. Additionally, this technology supports policymakers and urban planners in addressing underlying factors that contribute to crime in specific areas. This GIS application also benefits residents and community organizations by raising awareness about local safety concerns and encouraging engagement in neighborhood improvement initiatives.

Source: Neighborhood Source: Zillow


Cooper Week 1

Hi! My name is Kelsea Cooper and I am a junior double majoring in Public Health and Genetics! I am from Kent, Ohio. I have a cat named Marlin (he is very mischievous). In my free time I like to read, craft, and watch TV!

(Also including a photo of Marlin)

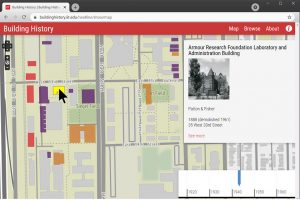
The whole reason I am taking this course is because of GIS’s application within public health so I was very excited that it was mentioned right out of the gate. It was really cool to learn about how GIS started by just layering paper on top of each other to initiate a whole field of study. In this section, I also learned the difference between spatial analysis and mapping. Spatial analysis generates information from maps and data where mapping simply represents the geographic data. Moving on to the section about “The Messy Business of Digging For Roots: GIS’s Intellectual Antecedents,” there was a specific quote that stood out to me which was “GIS is a relative newcomer to geography.” Although this is a very simple quote, it provoked quite a bit of thought because it prompted me to think about the grand scheme of things in terms of how long maps have been around and then when putting it on a timeline, GIS is on the very end of the timeline. Although it has been around for a short time on this scale, it has made tremendous impacts on so many different fields, including my own. As I mentioned above, I am a Public Health major and I wanted to take this course because there is so much application of GIS within the field. Schuurman mentions how important GIS is when monitoring outbreaks or when identifying areas of health disparities (just to name a few applications). Given this timeline and the timeline of when we really started to fully understand communicable diseases, I think that we are so lucky as a population that they were close to each other on this timeline. This also ties into another point Schuurman made about how virtually everything you have or eat/rely on these days now relies on GIS in one form or another. Overall, this reading made me very excited to explore all of the different applications within GIS and all of the good it can be used for!

Here are my searches:

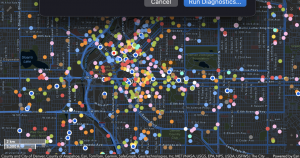
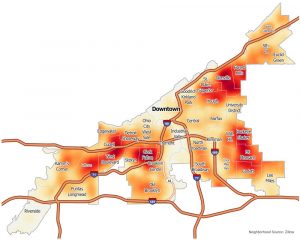
#1: My search was “smoking prevalence and access to health outcomes” but I was able to find this article called “Mapping a COVID-19 vulnerability: Areas of South and Midwest have fewer hospital beds and higher smoking rates”

This is a map that depicts each US county by smoking rate and hospital capacity. This is very important because not only is smoking more prevalent in areas that have lower socioeconomic status, but in addition, those areas also have less access to health care facilities. In this case, it also in concern with Covid-19, which smoking increases a person’s risk of severely being impacted by Covid-19.

Mapping a COVID-19 vulnerability. (2019). Truth Initiative. https://truthinitiative.org/research-resources/smoking-region/mapping-covid-19-vulnerability-areas-south-and-midwest-have-fewer

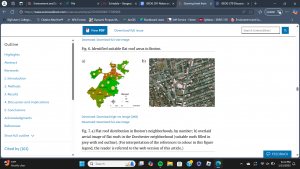
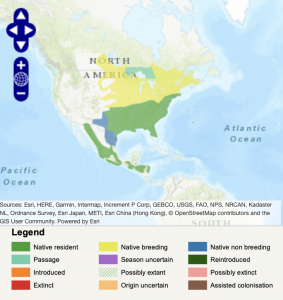
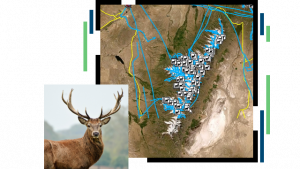
‌#2: My search was “US smokeless tobacco prevalence” I wasn’t really looking to compare this to any type of health outcome in this search, I was just curious what it would be across the US. However, when I was searching through some images, I found this one that compares global smokeless tobacco (SLT)  prevalence to policies that country has in place, “The global impact of tobacco control policies on smokeless tobacco use: a systematic review

The global impact of tobacco control policies on smokeless tobacco use: a  systematic review - The Lancet Global Health

The shading of each country indicates the prevalence of SLT usage, then there are icons also on each country to indicate what types of policies are in place for that country. I like the premise of the icons indicating policies but I will say it is a bit hard to read, especially for countries that are geographically smaller.

Chugh, A., Arora, M., Jain, N., Aishwarya Vidyasagaran, Readshaw, A., Sheikh, A., Eckhardt, J., Siddiqi, K., Chopra, M., Masuma Pervin Mishu, Kanaan, M., Rahman, M. A., Mehrotra, R., Rumana Huque, Forberger, S., Suranji Dahanayake, Khan, Z., Boeckmann, M., & Omara Dogar. (2023). The global impact of tobacco control policies on smokeless tobacco use: a systematic review. The Lancet Global Health11(6), e953–e968. https://doi.org/10.1016/s2214-109x(23)00205-x

Henderson Week 1

Hi! My name is Camryn Henderson, and I am a freshman. I am an Environmental Studies and Theater double major with a minor in Politics and Government. I am from Wadsworth Ohio, which is near Akron.

2. Schuurman reading

This chapter was an introduction to GIS, but instead of being a guide on how to use it, it instead it dove into why it is used, the best applications for it, and explained its importance to not only geography but all areas of study.  Before reading this chapter, I was unaware of the problems that can occur from using GIS, and I didn’t know that there could be significant faults in using it. I also found the history of GIS interesting, as I feel it gave better insight into what the program is used for and showed a clear difference between GIS now and originally. I did not not know much about GIS in general before reading this and I found that it gave a good overview of the general knowledge needed to do well in this course. I did not know that there was a difference between “mapping” and “spatial analysis” but learning about the differences between the two was super interesting. Spatial analysis is a term I have heard come up a lot in Environmental Science classes so learning a little bit more about what it is and vast amount you can learn from it was helpful. I chose to take this class not only to fulfill a requirement but also because as I have been doing research for internships, and possible future jobs I have noticed how important it is to be familiar with GIS, and spatial analysis; however I knew very little about what kinds of things I could use GIS for, and this book gave me more insight. Other than for urban planning and other environmental focused careers, I had not heard of GIS being used; however it can be used for sales, transportation, and health professions. This chapter provided me with baseline knowledge that I will be able to use throughout the semester.

3.  Buruso, F.H. Habitat suitability analysis for hippopotamus (H. amphibious) using GIS and remote sensing in Lake Tana and its environs, Ethiopia. Environ Syst Res 6, 6 (2018). https://doi.org/10.1186/s40068-017-0083-8

figure 4

This is a GIS image of the elevation sutiability for hippos in Ethiopia near Lake Tana. In the article where I found this analysis I found many others, all covering different criteria and their respective suitability. They were able to reclassify the data and determine suitability by elevation in this case.

Sarma, P. K., Mipun, B. S., Talukdar, B. K., Kumar, R., & Basumatary, A. K. (2011). Evaluation of Habitat Suitability for Rhino (Rhinoceros unicornis) in Orang National Park Using Geo-Spatial Tools. International Scholarly Research Notices2011(1)498258. https://doi.org/10.5402/2011/498258

Details are in the caption following the image

This image is from a similar study to the first one; however, this time it was focusing on the conservation of rhinos.  Due to rhinos being endangered it is very important for their habitats to be as preserved and suitable as possible. This study focused on suitability in different parts of a National Park in India.

Bahrey Week 1

Hello! My name is Ashley Bahrey and I am a junior Zoology, Environmental Science, and Geography major. I am from Bristolville, Ohio and I like to make jewelry and crochet in my spare time. I also have three cats that I love and adore!!!

I am one of the people that Nadine Schuurman is talking about in chapter 1 of GIS: A Short Introduction that previously did not know many of the core ways in which GIS is integrated in my daily life. The discussion around how GIS does not have a rigid identity because it is used to ask both where spatial entities are and how spatial entities may be encoded made me begin to consider just how interdisciplinary the use of GIS must be. I found Schuurman’s way of differentiating between spatial analysis and mapping by pointing out that mapping does not create more information than was originally provided to be very helpful in understanding these concepts. While Canada was credited for developing one of the earliest computer cartography systems, I thought it was interesting that GIS roots emerged somewhat simultaneously around the world in the 1960s. I really appreciate the lengths that Schuurman goes to make the content of this chapter straightforward and accessible. Her comparison of GIS to a calculator nicely set up the conversation she creates around GIS as a tool that can be used to visualize spatial data and “utilize fuzzy data”. Thinking of the visual aspect of GIS as a means of increasing the accessibility of spatial analysis is intuitive to me and definitely underscores the importance of GIS as a method of communicating big ideas in ways that can be digested by people with varying backgrounds. I also found the discussion surrounding the differences between GISystems and GIScience to be very informative, providing context for a new focus on researching the technical and theoretical problems associated with GIS. Additionally, the point that Schuurman raises about how map readers may interpret symbols and map representation differently seems paramount to visualizing spatial data in a way that can be accurately and efficiently utilized. Detailing some of the many ways that we rely on GIS in our everyday lives sets the stage for Schuurman’s overarching point that the intellectual and disciplinary ties of GIS must be studied in tandem with the technology itself to understand how modern society is organized and influenced by the digital realm. 


Search 1:GIS Application Eastern Bluebird Population Monitoring

This is a species distribution map for eastern bluebirds (Sialia sialis). While eastern bluebirds are categorized as of least concern (LC) on the IUCN Red List of Threatened Species, it is important to understand the range and habitat use of this species because these birds experienced serious population declines beginning in the early 20th century due to competition with invasive species and pesticide use. As low-aggression secondary cavity nesters, bluebirds were left with fewer places to nest. The installation of cavity nesting boxes designed to keep the larger birds like the invasive European Starling and bluebirds trails caused populations to rebound in the 1960s. Now, the population trend for eastern bluebirds is increasing. 

BirdLife International (2025) Species factsheet: Eastern Bluebird Sialia sialis. Downloaded from https://datazone.birdlife.org/species/factsheet/eastern-bluebird-sialia-sialis on 16/01/2025.

Search 2: “GIS Socioeconomic Status and Environmental Contaminants

Figure 1

This is a map of three ranges of critical health code violations (CHV) in 10,859 retail food service facilities overlaid on a map of poverty levels by census tracts in the city of Philadelphia, PA. The large number and close proximity of food service facilities make visual interpretations of mapping difficult, but this study found that food service facilities in higher poverty areas had a greater number of facilities with at least one CHV and underwent more frequent inspections compared to those in lower poverty areas. Additionally, the results of this study showed that facilities in census tracts with high concentrations of Hispanic populations had more CHVs than those in other demographic areas (Darcey & Quinlan 2011).

Darcey, V. L., Quinlan, J. J. (2011). Use of Geographic Information Systems Technology to Track Critical Health Code Violations in Retail Facilities Available to Populations of Different Socioeconomic Status and Demographic. Journal of Food Protection 74(9): 1524-1530. https://doi.org/10.1016/j.ygcen.2008.05.017 

Urton Week 1


Hi! My name is Iris Urton. I am currently a freshman and am an Environmental science major with an interest in minoring in botany or zoology. 


Before I decided to take this class I had no idea what GIS even was or what it stood for and even reading the course description I had no idea it has so many uses in our modern world besides environmental purposes. I find it interesting how philosophy plays into this by the way that its use and meaning changes based on the intentions of the user. Spatial analysis is very different from mapping apparently, and in the early days if GIS on was just referred to as the computerized version of the other because the immense application of this tool was not yet fully realized. Many rejected the idea of GIS at first because they didn’t see a benefit in using it if they could do the exact same thing on paper but it could do a lot more than that, it just wasn’t given a chance at first. The roots of GIS are hard to pinpoint because its development came at a time when all sorts of information were starting to be digitized. Not only did geographers start to use it but so did landscapers, surveyors and architects. I didn’t realize how long GIS has really been a thing and I can understand why cartographers were slow to change but I think it’s really incredible how GIS allows you to overlay information to get a clearer picture on the question you’re trying to answer. I wonder if GIS would be what it is today if people hadn’t started to ask questions about the accuracy of the system and how it can be made better. The thought that there could be a gender bias in how the system is used is very interesting to me and that the consequences of it can be bigger than we think. As an outdoorsy person I didn’t think that GIS would be something that really would interest me because I’ve always wanted to do something very hands-on and in the field like conservation but in the modern age I realized after reading this that it is becoming a very important tool and can be combined with many specializations including conservation. 


For my first application of GIS to look into I chose the conservation of endangered species. What I found is that with climate change still an ever prevalent issue in today’s world, our vast biodiversity of life is being threatened. The number of endangered species is rising but GIS has been an incredibly helpful tool in combating this issue. It allows conservationists to monitor and visualize population distribution, both historical and present, and track the efforts of the conservationists. They are also more easily able to gain better insight on where efforts are most needed.

Source: https://geo-jobe.com/mapthis/wildlife-conservation-powered-by-gis/

Another application of GIS I wanted to look into is about fox bats because they are one of my favorite animals and I find them really interesting. Something I learned from researching this topic is that fox bats are carriers of the Nipah virus and the transmission of the virus is due to habitat loss causing them to have to migrate to more populated areas, increasing the risk of human transmission. Pig farms are also a main source of potential contamination and happen to be a big part of Thailand agriculture. To prevent a possible spread of disease GIS is being used to map potential contact between bats, pigs and humans and to track bat colonies’ whereabouts. 

Source:https://pmc.ncbi.nlm.nih.gov/articles/PMC4389713/

Crane Week 1

My name is Zachary Kyan Crane, going by Kyan, and I am currently an Environmental Studies major. I am from a small town on the West Virginia side of the Ohio River named New Martinsville (about 45 minutes to an hour South of Wheeling). I’m a big fan of skateboarding/snowboarding (bad at both though), biking, and just about anything you can waste your time doing on a tv/pc.

If I was asked to create a new slogan for GIS it would go along the lines of “Seeing is Believing.”  In my opinion from what I gained from the chapter, GIS is a tool used to streamline and organize geographical data through visual imagery. It is clear that the way that any data is visually represented for the human brain to comprehend is imperative for any kind of planning or organization. I can totally see myself struggling to understand data points on a representing graph more than a comprehensive map. Within this humanization is the incredibly important need to organize a large amount of different points of data into one maneuverable format. I’m actually pretty excited to see all the different layers that a map can have and all the different variables that can be brought into one space. However, there is a need to recognize that this is not the end all of mapping and that GIS is more of an organization tool than a computing tool. I understand that for anyone using GIS it is still important to be able to actually understand the data being visualized so that I can be added upon, changed, or used for a project of some sort. One thing about all this that I felt seemed somewhat given were all of the different uses of GIS. It makes a lot of sense to me that many different projects and jobs use this technology to plan and understand the land that they are working on. It is incredibly important to understand the setting of whatever is about to happen.

One of the first things that came to mind for something that uses or is similar to GIS is a video game called Cities: Skylines. Its just a game where you build a city, but there is a complex info panel that shows you everything from mineral deposits to the happiness of your citizens. The 20+ overlays that can be accessed are all needed to sufficiently run your city.

https://www.esri.com/about/newsroom/arcnews/arcgis-urban-transforms-city-planning/

This is what this kind of thing looks like for real life applications in urban planning. Another good application that can relate back to urban planning is how to engineer the structures that have been assigned somewhere to be built.

https://www.esri.com/en-us/industries/aec/business-areas/design-engineering