Grogan Week 1

Hey, my name is Abbie Grogan. I am a junior and I am a Pre-Professional Zoology major with a chemistry minor. I am a captain of the women’s lacrosse team and a part of Kappa Phi, the PreVet club, and I work as a vet tech. I enjoy relaxing in my free time and trying new food.

Going into this course, I have very limited knowledge of GIS systems and applications overall. I did know their importance but I was not aware of the vast variety of uses that they can be applied for. After reading Schuurmans first chapter ofĀ GIS: A Short Introduction, I enjoyed learning the history behind the GIS development and how its uses grew over time. From this I was able to determine that GIS analysis has had very impactful implications for cities, social trends, health patterns, and environmental issues. I did not know how widely they could be used. To be completely frank, I was not expecting to truly enjoy this reading but I was captivated by the unknown importance of this type of tool.

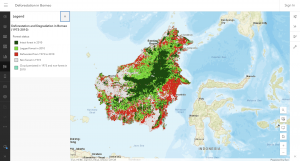
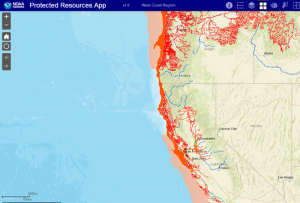
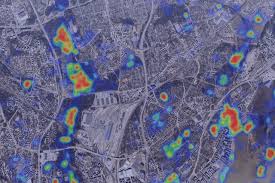
The first application I came across was emergency response planning. In emergency situations. One team called the Center for Robot-Assisted Search and Rescue (CRASAR)Ā  collected aerial imagery that helped to create vital GIS maps that visualized Hurricane Ianā€™s impact and guided emergency responders to find those in need of rescue faster than ever before. Using GIS, areas of risk and vulnerability are highlighted by combining critical infrastructure, hazard, and demographics data into a single map.

Hurricane Ian Searchers Saved Time with a Shared Map

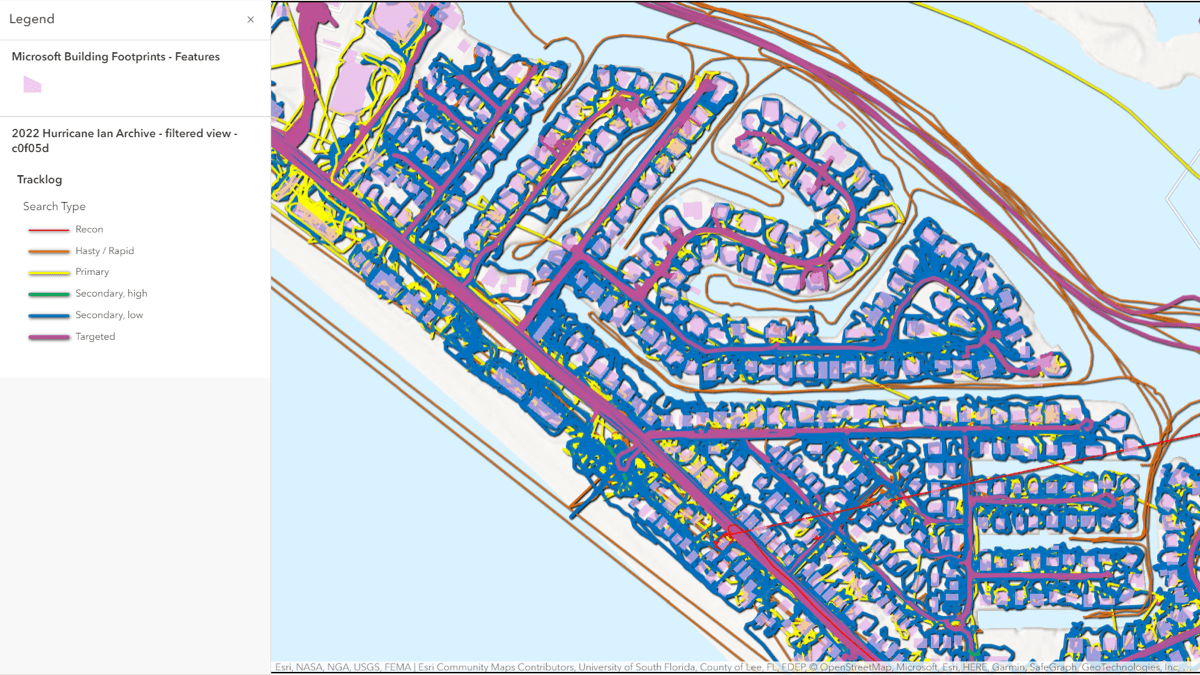
https://www.esri.com/about/newsroom/blog/hurricane-ian-searchers-shared-map/

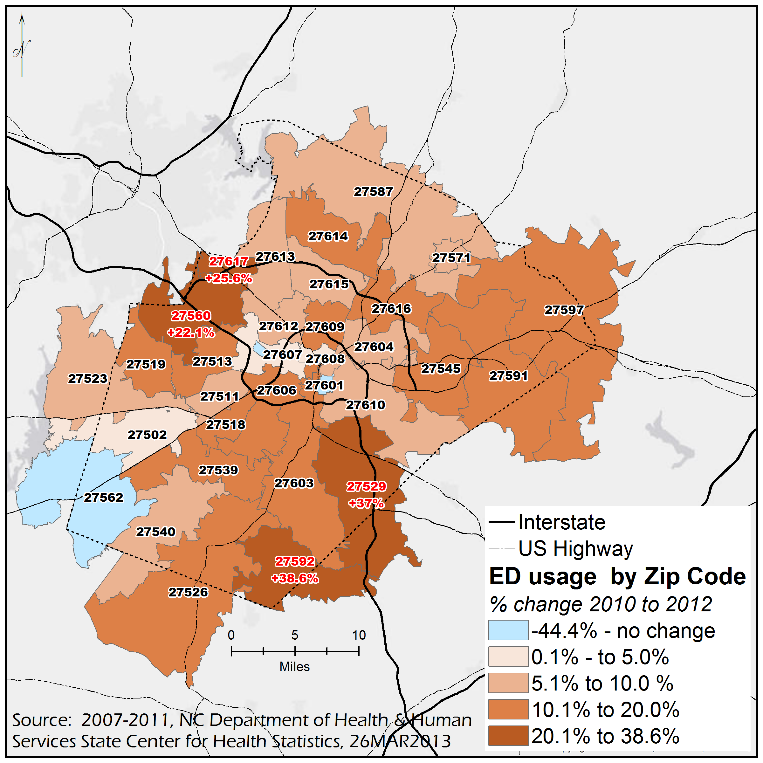
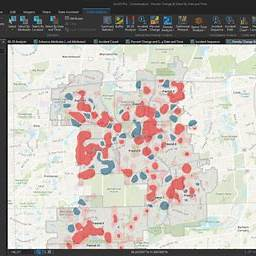
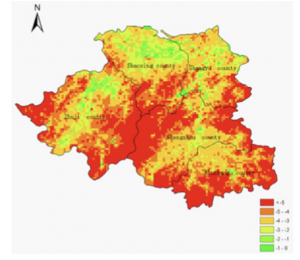
The second application I found was related to neighborhoods that use emergency departments within North Carolina. This specific GIS shows the changed in ED use over 2 years depending on the neighborhood they were in.

Percent Change in Emergency Department Usage by Zip Code, Wake County Community Health Needs Assessment, North Carolina, 2007-2011

GIS and Spatial Health


Heumasse Week 1

Hi! My name is Claire Heumasse, and Iā€™m a Junior from Scarborough, ME. I am majoring in Biology at Ohio Wesleyan University and am involved in the Cheer team, Women in Science club, and Rock climbing club. In my free time, I enjoy ice skating and reading books.

In reading Schuurmans first chapter of GIS: A Short Introduction, I expected a boring, technical overview, but I was surprised by how easy it was to understand and how interesting it turned out to be. Schuurman highlights how GIS is not only a practical tool but also a lens to understand and analyze complex spatial data. I also found the historical development of GIS fascinating, particularly how overlay techniques evolved from physical maps to digital platforms. What stood out most was the discussion on GISā€™s versatility. From urban planning to public health, the potential applications of GIS are seemingly endless. I was especially intrigued by how GIS is used to map crime patterns and analyze their spatial relationshipsā€”a tool that can influence public policy and improve safety.

For the first GIS application, I explored its use in Indonesia. GIS is employed to monitor deforestation in Kalimantan and Sumatra. By mapping forest cover changes over time, researchers can identify illegal logging hotspots and assess the impact of deforestation on biodiversity. This application is crucial for protecting endangered species, such as orangutans, that rely on these habitats.

Ā 

Source: https://www.arcgis.com/home/item.html?id=60e5dfae803c48ac932a9117f28c6694

For the second application, I searched ā€œcrime mapping GISā€ and found an example in Houston, Texas. GIS is being used to analyze violent crime patterns in the city, helping law enforcement allocate resources effectively. By creating heatmaps of high-crime areas, officials can identify correlations between crime rates and urban features like poorly lit streets or abandoned buildings. For instance, GIS data has highlighted specific neighborhoods where targeted interventions, such as increased police presence and community programs, have led to measurable reductions in crime.

Source: https://www.arcgis.com/apps/instant/sidebar/index.html?appid=1427304b9e6048a488e0be90b3aa1cd7

Powell Week 1

Hi, my name is Jes Powell.Ā  I’m a senior and I am majoring in Studio Art.Ā  I am from the Cayman Islands and I live/grew up on the beach.Ā  I love photography and writing.

Chapter 1 of Schuurmanā€™s GIS: A Short Introduction discusses the importance of Geographic Information Systems (GIS) and how it can be found everywhere.Ā  GIS is used for a variety of different tasks and oftentimes people donā€™t realize how extremely impactful it can be.Ā  To each individual GIS is important and effective for various different personal reasons.Ā  For example in a city GIS can be crucial when it comes to planning residential, industrial, and commercial zones; this is just one of the many ways that GIS can be used.Ā  GIS uses mapping and data analysis to find solutions and allows for data to be interpreted in a way that can be an aid for planning and research.Ā  There are two main components of what the acronym GIS stands for; this being GISystems and GIScience.Ā  GISystems more so focuses on ways of analyzing and mapping out data and is more commonly thought of when considered the acronym GIS.Ā  On the other hand GIScience focuses more on the overall explanation of questions related to how GIS software puts out its output.Ā  I think it’s interesting that there are two different meanings to the acronym of GIS and that it is not just simply Geographic Information Systems.Ā  The most important part about these two faces of GIS discussed in this section of the chapter is how spatial phenomena is translated into digital terms; this is essentially what connects both GISystems and GIScience.Ā  GIS is an extremely diverse tool that impacts everyday life for a majority of people.Ā  I think most people donā€™t realize that GIS goes beyond just something that is technological as it can be the deciding factor for numerous things.Ā  GIS technologies have a major role in food production and agriculture, and can impact government and business decisions.Ā  GIS technologies impact every part of our life and it is an important tool to understand what is used for and what exactly it means and what type of data is getting taken in and what data is being outputted.

GIS Applications

  1. I looked up how GIS applications are used for the Cayman Islands and I found how it can be used in Grand Cayman (the main island)Ā  to determine which areas are more exposed to flooding and which areas are more exposed to specific hurricane categories.Ā  I think this is important information to take into consideration as it can be necessary for future plans of how land is used and what developments are made.

    https://link.springer.com/article/10.1007/s11069-010-9539-0
  2. Ā The second thing I looked up related to GIS applications is how it can be used to see the specific areas in the Cayman Islands that are turtle habitats.Ā  This is important as these areas are protected during turtle nesting season and there are specific turtle nesting sites that you are not allowed to go to so that the process isnā€™t disrupted.Ā  I think the use of GIS applications to be able to see this information is crucial because it ensures that these marine animals are able to safely and effectively go through their normal process of nesting and returning to the ocean without natural and man made obstacles that would otherwise prevent them from doing so.

    https://www.frontiersin.org/journals/marine-science/articles/10.3389/fmars.2021.663856/full


Flores week 1

Hi my name is Daniela Flores (she/her) I am a sophomore majoring in environmental science. I’m from Philadelphia PA, I love listening to music and going on walks.

Chapter 1

When people think of GIS, they believe it’s only software for geographers because of its ability to document and log locations. In reality, everyone uses it, and it is a helpful tool for anyone in any subject or job position. GIS can help with basically anything that is in any place that can be documented.Ā 

With GIS we can visualize things we couldnā€™t when it was just with pen and paper. We can see the repercussions of potential construction in areas and how it can damage the environment without doing anything to the area. GIS reminds me of a layered cake, layering different layers of the land, soil, forest, housing/buildings to create one map that includes all the characteristics of one area. One thing I like about GIS that this chapter talked about was how when using GIS the facts and data donā€™t have to be as precise, there can be guesstimates to see how things would look while finalizing data or making hypotheses while mapping. GIS is also good for visual learners, they can see the separate layers of the area and learn about it in an easier format instead of reading long articles about data. With this visual format, it can be easier to solve problems as they are now imitating what someone is trying to hypothesize. With GIS we are not only able to address environmental concerns but also human concerns like crime, femicide, and social changes. GIS can help with anything you can think of, it is a powerful, and accessible tool that anyone can use. I wonder if GIS has been purposefully used to urbanize and gentrify certain areas because they seem like good areas to build businesses without identifying the places that were there before.Ā 

Two GIS applicationsĀ 

One GIS application I looked up was feminicide, I found one based in Antioquia, Colombia. This paper focuses on studying feminicide from a geographical perspective, and seeing how the relationship with drug trafficking in geographical locations impacts feminicides.Ā 

Source: The spatial heterogeneity of factors of feminicide: The case of Antioquia Colombia

The second GIS application I looked up was Landslides in Colombia. They used GIS to estimate groundwater levels and compare them to rainfall events. They also compared it with earthquakes to see their relationship and how they could predict landslides.Ā 

https://onlinelibrary.wiley.com/doi/epdf/10.1002/%28SICI%291096-9837%28199609%2921%3A9%3C853%3A%3AAID-ESP676%3E3.0.CO%3B2-C


Fondran Week 1

Hi! I am Jade Fondran, a sophomore studying Zoology and minoring in Environmental Science. I am from Euclid, Ohio a suburb of Cleveland. I have a dog, two cats, and three fish.

Before reading this article I was unaware at how prevalent GIS is in each of our lives. I was surprised to know that a company like Starbucks uses GIS in order to strategically place each of their locations. I found this specific quote explaining GIS to be interesting “It is not a piece of software, but a scientific approach to the problem: ”how do we define crisp boundaries to demarcate fuzzy and changeable phenomena?” ” I thought this was an insightful way to explain how GIS can be used for many different things.

The identity crisis of GIS began in the 1960s when Ian Mcharg was determining how to fit a highway into the landscape properly. He used overlays of paper with forests, streets, buildings, etc on each layer and determined the best route. This overlay method became the basis for GIS and other spatial analysis techniques.Ā  This concept of overlaying paper was translated into one of the earliest GIS systems on a computer. I always find stories of how some of the first computers worked and how they were created to be very fascinating.

In a later section, What Does the Acronym GIS Stand For? The Two Faces of GIS , it explains howĀ  important Ā the translation of spatial phenomena is made into digital terms. Slight differences can change the results for analysis, and it is important for GIScience. I found it interesting that GIS is multifaceted and is not just one thing. Overall, I found this reading insightful and thoroughly introduced me to what GIS is and how important it is to society.

  1. “GIS Application on Endangered Sharks”

GIS is used very often when determining where animals are most threatened. Making it very important to those who work in conservation. For example, the picture I found shows areas in which habitats of certain animals are protected under the Endangered Species Act. This specific example was made by NOAA Fisheries in order to make it easier for the public to identify protected areas.

2. “GIS application on plants”

GIS application can be used frequently when dealing with agriculture. For example, it can be used to help determine crop growth while analyzing fertilizer, soil type, and terrain. This map shows “Fertilizer application assessment based on data from field equipment, processed with EOSDA Crop Monitoring.” GIS software is very important in many aspects of agriculture and benefits all who utilize it in order to have the most efficient practices.

https://sites.owu.edu/geog-291/wp-content/uploads/sites/208/2025/01/print.pdf

Sources:

https://www.fisheries.noaa.gov/feature-story/new-app-makes-endangered-species-habitat-easy-find

https://eos.com/blog/gis-in-agriculture/

Banti Week 1

GEOG291 Introduction


Hello! My name is Panagiota Banti but people call me Naya! I am an international student from Greece and I am double majoring in Computer Science and Data Analytics. My favorite food is sushi and I love going to the gym and hanging out with my friends. On campus, I am also a cheerleader and part of the Computer Science and Programming Club.


To begin with I don’t have any knowledge about GIS. This passage helped me understand a lot about GIS from its history to questions a tool like this might raise. The passage successfully explained the history of GIS and how it evolved to become an important tool in many different fields. GIS is used for mapping and not only. It analyzes cities, social trends, health patterns, and environmental issues. However, there are some issues concerning society that haven’t been discussed thoroughly.Ā 

This type of technology has many uses but it raises the question of what its true purpose is because it is used in different ways across various fields. GIS can be said that is shaped by a combination of social and academic ideas and its data is used to help with important decision-making. Therefore, we understandand analyze the world around us and GIS plays a fundamental role in our everyday lives without knowing it. I was fascinated by how many uses GIS has that we didn’t know of. I thought that GIS is solely used for environmental or geographical reasons and therefore, learning about all its uses is something that surprised me.


Something that I found interesting is the privacy concerns GIS raises data privacy and centralization of powerbecause GIS can track everything and keep private information. Even more concerning is the fact that there is no privacy safeguards for this issue.Ā 

Another interesting thing that I didnt know about is that GIS is something that younger people know already when coming to college and that shows again how important this tool is starting to be in our everyday lives, and the same goes in academia. There are still challenges in collecting and organizing data from GIS but this issue seems to be in progress.Ā 


GIS Applications


  1. Contaminated sitesĀ 

GIS applications in contaminated sites are essential for, monitoring, and managing environmental contamination. Hazardous materials such as heavy metals, chemicals, radioactive substances. The research I found was how GIS protected people from contaminated water.Ā 

https://mcwec.org/2023/11/using-gis-technology-to-protect-people-from-contaminated-water-part-1/

  1. CrimeĀ 

GIS helps law enforcement agencies make data-driven decisions by giving them visual representations of crime trends which makes it possible for them to recognize patterns, distribute resources effectively, and create focused treatments.

https://crimetechweekly.com/2015/10/20/what-is-geospatial-crime-mapping/

White Week 1

  1. Hi! My name is Will White. I am a junior here at Ohio Wesleyan. I am a Business Management major and also a member of the Ohio Wesleyanā€™s Menā€™s Lacrosse team where I play goalie. I am from Pelham, New York which is right outside of New York City.


  1. Chapter 1 of Nadine Schuurmanā€™s GIS: A Short Introduction outlines the growing significance of Geographic Information Systems (GIS) in modern life and its diverse applications across fields like urban planning, agriculture, epidemiology, and commerce. GISā€™s ability to integrate spatial data and generate meaningful insights has made it indispensable, though its identity remains fluid and multifaceted. Schuurman highlights the dichotomy of GIS as both a technical tool (“GISystems”) and a broader field of inquiry (“GIScience”).One key takeaway is how GIS has evolved from simple computerized cartography to a sophisticated analytical tool. For example, it enables urban planners to visualize traffic impacts or epidemiologists to track disease outbreaks, emphasizing its capacity to combine spatial analysis with intuitive visualization. Schuurman also stresses how GIS has shaped daily life, from determining waste collection routes to optimizing retail locations like Starbucks. What stands out is the tension between the technical and philosophical aspects of GIS. While it excels in creating visually accessible data representations, the author argues that GIS users must understand the underlying assumptions and potential biases in data encoding and boundary definitions. For instance, how we classify spatial phenomenaā€”such as community boundariesā€”can drastically affect analysis outcomes. Schuurman also touches on the collaborative and ethical dimensions of GIS, mentioning feminist perspectives and Public Participation GIS (PPGIS). These approaches seek to democratize GIS technology, emphasizing inclusivity and questioning whose interests GIS serves. Overall, this chapter provides a balanced introduction to GIS, celebrating its technical achievements while encouraging critical reflection on its societal impacts. It effectively sets the stage for readers to explore GIS’s complexities beyond its surface applications, prompting questions about its role in shaping how we interact with and interpret the world.


  1. GIS plays a crucial role in crime analysis by helping law enforcement visualize and understand crime patterns. Through mapping hotspots, it highlights areas with high crime concentrations, enabling targeted patrols and resource allocation. For example, police in Los Angeles have successfully reduced crime rates by focusing efforts on these mapped hotspots. Additionally, GIS supports predictive policing by analyzing historical data and environmental factors to forecast where crimes are likely to occur, allowing proactive measures to prevent incidents. A crime density map of Washington D.C. illustrates how GIS identifies areas with frequent incidents, guiding more effective strategies. Overall, GIS enhances crime prevention and contributes to building safer communities


https://www.esri.com/en-us/industries/law-enforcement/strategies/crime-analysis?utm_source


Siegenthaler Week 1

Introduction

Hi, my name is Will Siegenthaler. Iā€™m a junior majoring in Economics. I play lacrosse, enjoy playing basketball, and like to read in my free time. This is my first experience with GIS, and Iā€™m looking forward to learning more about its applications and relevance in different fields.

Schuurman Chapter 1

Before reading Chapter 1 of Schuurman, I didnā€™t know much about GIS or its history. It was interesting to learn how GIS was initially viewed as just a computerized version of mapping and how its broader applications werenā€™t recognized early on. I found the discussion about how spatial analysis differs from traditional mapping to be particularly thought-provoking, especially the idea that GIS can layer and analyze data to answer complex questions.

The chapter also emphasized how GIS became a multi-disciplinary tool, used by geographers, architects, and others. It was surprising to read about the initial resistance to GIS, especially from cartographers who preferred traditional methods. Over time, though, it has proven to be far more powerful than paper-based systems.

One point I found compelling was how GIS can reflect user biases, including gender biases, which can have far-reaching implications. It raised questions for me about how the technology can be refined to minimize unintended biases. Overall, the reading showed me that GIS can be a valuable tool in fields like economics, urban planning, and environmental science, which I hadnā€™t considered before.

GIS Applications

  1. Crime Mapping and Analysis
    GIS is widely used in law enforcement to map and analyze crime patterns. Heatmaps created with GIS help identify crime hotspots, allowing police departments to allocate resources more effectively. For example, predictive crime mapping uses historical data to forecast where crimes are likely to occur, helping to improve public safety and reduce crime rates.

Source: ESRI Blog – Crime Mapping and GIS

  1. Urban Planning and Smart Cities
    In urban planning, GIS supports the development of smart cities by helping planners analyze land use, infrastructure, and population density. For instance, GIS can optimize public transportation routes, map energy consumption, or assess areas prone to flooding. These tools enable planners to make data-driven decisions that enhance the quality of life in urban areas.

Source: GIS Geography – GIS in Urban Planning


Jolliff Week 1

My name is Hazel Jolliff. I am a Junior and I am majoring in Environmental Science. This is only my second year as an Environmental Science major so I am still kind of new to it all. I run Track & Field here at OWU and my main event is javelin. I am a commuter and I live on a farm and i love my pigs, so that is fun! Other than that I’m taking this course to learn more about GIS and get an idea of how it all works.

The Shuurman reading was very interesting to me. GIS is a pretty new concept to me and I didn’t realize how much it affects our everyday lives. There are alot of people and places that depend on GIS for things. The readingĀ  explained the beginnings of GIS and how it was just a regular map with different layers on top. I thought this to be pretty simple but it explains that with technology now, it is much more efficient and has expanded more than what it originally was. The reading talks about the early computers and how they weren’t able to do nearly as much when it came to GIS as they can do now. Even though the first computers werenā€™t around that long ago it shows that GIS has come a long way in a short amount of time. I find this interesting because GIS seems to have a hold on the way things function in this world. It says in the beginning about how Starbucks uses GIS to figure out where its best coffee shops are. And it seems fairly obvious that Starbucks also has a hold on the way things function in this world. Big businesses, all the way to farmers/ranchers figuring out where to graze their livestock, GIS is an important resource and I guess this reading really opened my eyes to that fact. In the first section of the reading there was a paragraph or two explaining that some Academic Geographers have a love/hate relationship with GIS. Going on to say that GIS is only ā€œone lens on the social and physical worldā€ so Iā€™m wondering if academic geographers are concerned that too many young people are going to only focus on GIS instead of the other forms of mapping and what not.

My Searches:

#1. My search was ā€œ GISā€ and ā€œCrop Damageā€

Reference: Lou, W., Ji, Z., Sun, K., & Zhou, J. (2013). Application of remote sensing and GIS for assessing economic loss caused by frost damage to tea plantations. Precision Agriculture, 14(6), 606ā€“620. https://doi-org.owu.idm.oclc.org/10.1007/s11119-013-9318-5

The article titledĀ  ā€œApplication of remote sensing and GIS for assessing economic loss caused by frost damage to tea plantationsā€Ā  focused on developingĀ  a way to determine economic loss due to spring frost in tea plantations. The map used remote sensing and GIS to form a spatial distribution of temperatures in the given production area.

#2. My search was ā€œ GIS Applicationā€ and ā€œArchaeologyā€

Reference: Ebert, D. (2004). Applications of Archaeological GIS. Canadian Journal of Archaeology, 28(2), 319ā€“341.

The journal was titled ā€œ Applications of Archaeological GISā€. This is an example of a predictive model, the dark circles represent existing sites that were used to base the model off of.

Naples Week 1

Hey! My name is George Naples and I’m a Junior from Youngstown, Ohio. I am double majoring in Environmental Studies and Geography. Ā In my free time I enjoy collecting vinyl records, going to concerts, learning about cars, and watching TV. I also have an almost 2 year old golden doodle named Arlo.

Ā  Ā 

In reading Schurrmanā€™s first chapter of GIS: A Short Introduction, I expected a far more textbook, scientific explanation of the software. As most of my previous studies have leaned toward the field of Human Geography, this was a pleasant surprise. After all, Geography can always bend and be applied to what you are researching so this shouldnā€™t be too shocking. Although this summary was not limited to developments from a Human Geography perspective, the necessary scientific explanations were present. It created an easily digestible culmination of the uses of this versatile software. The simultaneous development of GIS in completely separate countries was very interesting to read about. This entirely emphasizes the importance of this software and the necessity of it being developed. The use of overlays from the original physical pieces of paper to what we now know as overlays was something that I had never considered. The section in which Schurrman defined the difference between ā€˜mappingā€™ and ā€˜spatial analysisā€™ was a critical section to explain the importance of GIS. ā€œMapping represents geographical data, with varying degrees of fidelity, in visual form.ā€ Spatial analysis generates more data upon the geographical location than that of mapping can provide.I was pleasantly surprised to learn of how many unique uses GIS has in modern application. The application that caught me the most off guard was when Starbucks was mentioned. I have worked at Starbucks for almost five years consecutively at this point, and this company does not come off as tech-savvy in the slightest. I had heard that Starbucks considers a number of factors when finding locations for new stores such as median household income, traffic volumes, etc, however I did not get the impression that this process would have so much overlap with my academic goals. This diversity of uses within GIS makes perfect sense when understanding the definition of spatial analysis.Ā 

For the first application of GIS, I searched “household income GIS.” I was presented with an entire mapping of the continental United States with information for every census district in 2023. In order to have a small, more digestible population of data, I chose my hometown. Youngstown, Ohio is part of the midwest rust belt. This means that the inner cities are known for levels of poverty reaching far past the national average. While the data does still determine that this trend of poverty has not changed, it does show an improvement from what these incomes were when I was growing up. When I was growing up in the mid to late 2000s, I remember household incomes averaging around $20,000. This data showed that the area in the city with the lowest median household income averages around $12,000. While this specific piece of data does not indicate any growth , the rest of the city shows averages Ā from $20,000 to $40,000.

Ā  Ā 
https://owugis.maps.arcgis.com/apps/mapviewer/index.html?webmap=9e256998acd64827a2ec22574c4bd923

For my second application I searched “Heat map GIS.” I once again chose to focus on my hometown. This map showed different statistics of urban heat in metropolitan areas. This issue with heat is linked to underinvestment not only economically but also infrastructurally. This map shows that the same areas with low household income averages are shared by areas that have urban heat challenges. However, they are not entirely the same. This is due to the lack of any inhabitance in large portions of Youngstown after Black Monday in 1977 which caused a mass exodus from the city. Youngstown has worked tirelessly over the last 45+ years to ‘clean up’ the city. This included demolitions of completely abandoned neighborhoods. The heat map certifies that these efforts have made an improvement. However, the impoverished neighborhoods of the inner city where a majority of the population still resides needs a solution.

https://www.arcgis.com/apps/mapviewer/index.html?layers=d77c640241d84b6889ab290cd4cb755b