My name is Zachary Kyan Crane, going by Kyan, and I am currently an Environmental Studies major. I am from a small town on the West Virginia side of the Ohio River named New Martinsville (about 45 minutes to an hour South of Wheeling). I’m a big fan of skateboarding/snowboarding (bad at both though), biking, and just about anything you can waste your time doing on a tv/pc.

If I was asked to create a new slogan for GIS it would go along the lines of “Seeing is Believing.” In my opinion from what I gained from the chapter, GIS is a tool used to streamline and organize geographical data through visual imagery. It is clear that the way that any data is visually represented for the human brain to comprehend is imperative for any kind of planning or organization. I can totally see myself struggling to understand data points on a representing graph more than a comprehensive map. Within this humanization is the incredibly important need to organize a large amount of different points of data into one maneuverable format. I’m actually pretty excited to see all the different layers that a map can have and all the different variables that can be brought into one space. However, there is a need to recognize that this is not the end all of mapping and that GIS is more of an organization tool than a computing tool. I understand that for anyone using GIS it is still important to be able to actually understand the data being visualized so that I can be added upon, changed, or used for a project of some sort. One thing about all this that I felt seemed somewhat given were all of the different uses of GIS. It makes a lot of sense to me that many different projects and jobs use this technology to plan and understand the land that they are working on. It is incredibly important to understand the setting of whatever is about to happen.
One of the first things that came to mind for something that uses or is similar to GIS is a video game called Cities: Skylines. Its just a game where you build a city, but there is a complex info panel that shows you everything from mineral deposits to the happiness of your citizens. The 20+ overlays that can be accessed are all needed to sufficiently run your city.

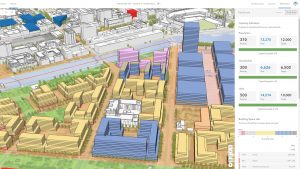
https://www.esri.com/about/newsroom/arcnews/arcgis-urban-transforms-city-planning/
This is what this kind of thing looks like for real life applications in urban planning. Another good application that can relate back to urban planning is how to engineer the structures that have been assigned somewhere to be built.
https://www.esri.com/en-us/industries/aec/business-areas/design-engineering