Hello! My name is Ashley Bahrey and I am a junior Zoology, Environmental Science, and Geography major. I am from Bristolville, Ohio and I like to make jewelry and crochet in my spare time. I also have three cats that I love and adore!!!

I am one of the people that Nadine Schuurman is talking about in chapter 1 of GIS: A Short Introduction that previously did not know many of the core ways in which GIS is integrated in my daily life. The discussion around how GIS does not have a rigid identity because it is used to ask both where spatial entities are and how spatial entities may be encoded made me begin to consider just how interdisciplinary the use of GIS must be. I found Schuurman’s way of differentiating between spatial analysis and mapping by pointing out that mapping does not create more information than was originally provided to be very helpful in understanding these concepts. While Canada was credited for developing one of the earliest computer cartography systems, I thought it was interesting that GIS roots emerged somewhat simultaneously around the world in the 1960s. I really appreciate the lengths that Schuurman goes to make the content of this chapter straightforward and accessible. Her comparison of GIS to a calculator nicely set up the conversation she creates around GIS as a tool that can be used to visualize spatial data and “utilize fuzzy data”. Thinking of the visual aspect of GIS as a means of increasing the accessibility of spatial analysis is intuitive to me and definitely underscores the importance of GIS as a method of communicating big ideas in ways that can be digested by people with varying backgrounds. I also found the discussion surrounding the differences between GISystems and GIScience to be very informative, providing context for a new focus on researching the technical and theoretical problems associated with GIS. Additionally, the point that Schuurman raises about how map readers may interpret symbols and map representation differently seems paramount to visualizing spatial data in a way that can be accurately and efficiently utilized. Detailing some of the many ways that we rely on GIS in our everyday lives sets the stage for Schuurman’s overarching point that the intellectual and disciplinary ties of GIS must be studied in tandem with the technology itself to understand how modern society is organized and influenced by the digital realm.
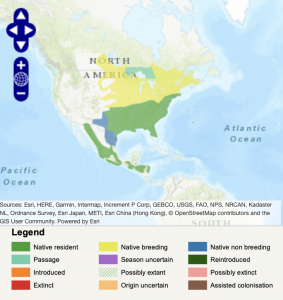
Search 1: “GIS Application Eastern Bluebird Population Monitoring“

This is a species distribution map for eastern bluebirds (Sialia sialis). While eastern bluebirds are categorized as of least concern (LC) on the IUCN Red List of Threatened Species, it is important to understand the range and habitat use of this species because these birds experienced serious population declines beginning in the early 20th century due to competition with invasive species and pesticide use. As low-aggression secondary cavity nesters, bluebirds were left with fewer places to nest. The installation of cavity nesting boxes designed to keep the larger birds like the invasive European Starling and bluebirds trails caused populations to rebound in the 1960s. Now, the population trend for eastern bluebirds is increasing.
BirdLife International (2025) Species factsheet: Eastern Bluebird Sialia sialis. Downloaded from https://datazone.birdlife.org/species/factsheet/eastern-bluebird-sialia-sialis on 16/01/2025.
Search 2: “GIS Socioeconomic Status and Environmental Contaminants“

This is a map of three ranges of critical health code violations (CHV) in 10,859 retail food service facilities overlaid on a map of poverty levels by census tracts in the city of Philadelphia, PA. The large number and close proximity of food service facilities make visual interpretations of mapping difficult, but this study found that food service facilities in higher poverty areas had a greater number of facilities with at least one CHV and underwent more frequent inspections compared to those in lower poverty areas. Additionally, the results of this study showed that facilities in census tracts with high concentrations of Hispanic populations had more CHVs than those in other demographic areas (Darcey & Quinlan 2011).
Darcey, V. L., Quinlan, J. J. (2011). Use of Geographic Information Systems Technology to Track Critical Health Code Violations in Retail Facilities Available to Populations of Different Socioeconomic Status and Demographic. Journal of Food Protection 74(9): 1524-1530. https://doi.org/10.1016/j.ygcen.2008.05.017