
Hi, my name is Rene Villanueva-Henkle, and I am a triple major in Junior Environmental Studies, Biology, and Philosophy. I spend a lot of my time being outside, staying active, and working on building/fixing computers.
I found it interesting that after the introduction pushes this idea that all disciplines, City Planning, Construction, Conservation, and Social Work use GIS, the initial software was created by two men with an ENVS Background. While I know anyone can use this software, it makes it feel that much more special to use it within this discipline. I found the story of the creator of the initial concept of GIS pretty interesting, in that it preceded its own technology. I was having trouble understanding the difference between GISystems and GIScience, but it became clear to me after the example of John Snow. It was easier for me to see how his work mapping and tracking cholera deaths was GISystems, and him going out into the field and asking questions to the Workhouse inmates and investigating himself was GIScience.
I was also surprised to read that GIS is the program used in Traffic distribution and disruption calculations. I honestly think at times that Delaware City Planners don’t care about traffic, especially with the booming population coming in from Columbus workers, but I fear I will have to give them more credit. Or perhaps lenience would be the better word.
I also found the usage of GIS is E-commerce, specifically for sites like Amazon to be particularly interesting. I have noticed in the past few years that there could be as many as 5 different delivery drivers for Amazon on my block wide stretch of Sandusky within one week, all of them being regulars as well. I now realize that it is possible there are people (or automated programs) using GIS to find the most efficient route for each individual driver based on their packages each day, which is fascinating to me. I can’t imagine the processing power it would take to do that for every driver in central Ohio, let alone the U.S. and internationally.
First Search GIS+MOSS+POPULATION
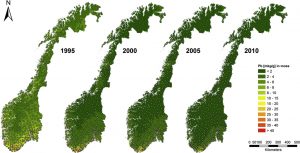
This is a pretty primitive version of GIS, but this map shows concentration of lead in moss across Norway over a 15 year span. There are also other maps showing cadmium and mercury concentration in moss, as well as the concentration of all three of these metals in the surface soil in the same places. This study revealed that the Surface soil was soaking up much more of these heavy metals than the moss was. https://doi.org/10.1016/j.atmosenv.2014.09.059
Second Search: GIS+COMPUTER+INCOME
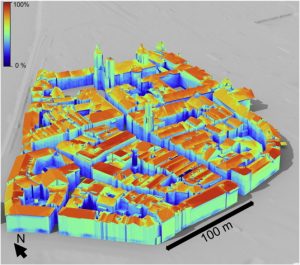
This also did not provide what I was looking for (A map of household income compared to how many computers in each household) but proved to be equally interesting. This is a 3d model of the town of Innsbruck, Austria, that is imported into GIS, and shows the locations that would be able to use solar most effectively. The group did computations to show irradiation for 183 simulated days.