Chapter 9:
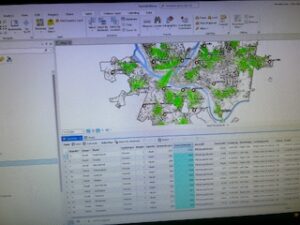
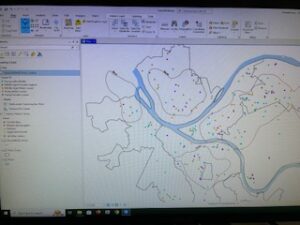
- 9.1– Straightforward. I understood the applications.
- 9.2– Pretty easy and straightforward, similar to the 9.1 application.
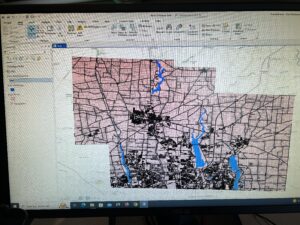
- 9.3– In this tutorial I was having trouble changing the color of the polygons to the chips colors. I ended up changing them to a blue variation but didn’t understand where to find the needed color scheme. Once I got the calculate field in the polygon table I kept getting an error message and I don’t know what was going wrong. I couldn’t figure out how to continue once I got the error message.
- 9.4– Easy tutorial. I understood the steps and application.
- 9.5– I understood the contents of this tutorial.
Chapter 10:
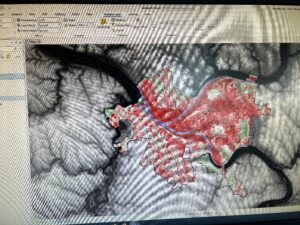
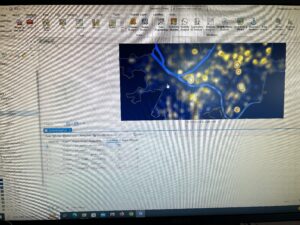
- 10.1– Straightforward and easy to understand.
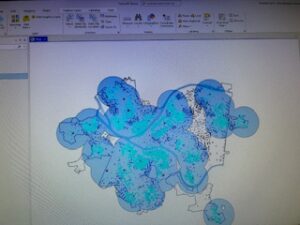
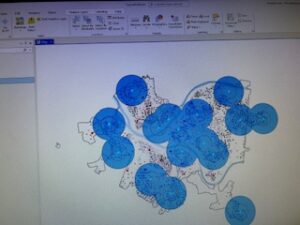
- 10.2– When I put the symbology information in my map it had different colors than the book stated. This tutorial wasn’t too bad once I found where certain tools and applications were.
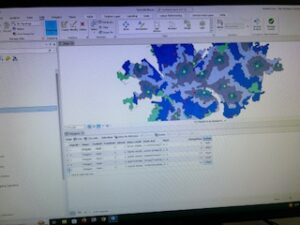
- 10.3– Straightforward until. I got confused once I had to put in the expressions for the raster calculator. Therefore, I had to stop because I got confused and couldn’t figure out how to continue.
-
Chapter 11:
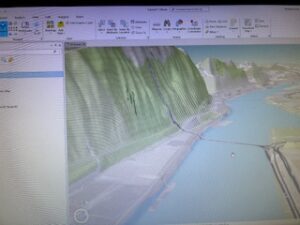
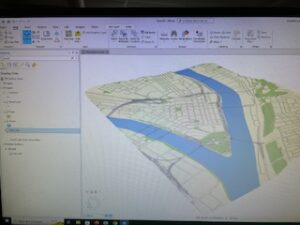
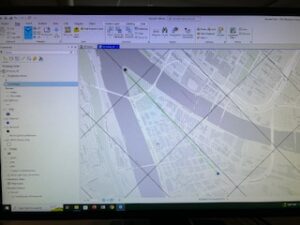
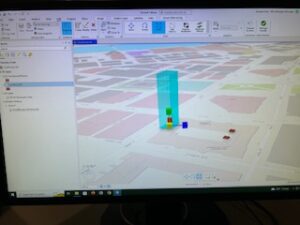
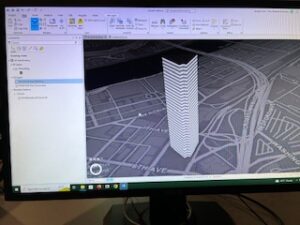
- 11.1– This tutorial was really cool to see the 3D dimensions and how to move the map in different ways.
- 11.2– This was straightforward and I understood the process. It was interesting to see different layer colors.
- 11.3– The create features tool wasn’t working and I wasn’t sure what was happening. Because of this I wasn’t able to fully complete the section.
- 11.4– Towards the end I couldn’t find the bridges in the created features. I was able to finish the tutorial but by the end portion my line of sight wouldn’t become 3D and I couldn’t figure out how to change that.
- 11.5– This tutorial went smoothly and was really cool to see the scaling aspect.
- 11.6– This tutorial was going smoothly until I got the symbology pane. I was struggling to find this information. I was able to complete the rest of the tutorial.
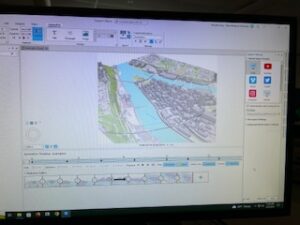
- 11.7– This was easy to understand and really cool to see the animations.
Delaware Data
- Survey– This is a shape file that combines data from the recorder’s office and the map department. It was stated that the points on the map illustrate the survey plats.
- MSAG– This data is known as the master street address guide. This data illustrates the 28 different political jurisdictions. This is used to find and analyze boundaries.
- Parcel– This is data for the cadastral parcel lines in Delaware. These are represented by polygons.
- Precinct– This data illustrates the voting precincts that are compiled by the county auditor’s office. Data is updated as needed.
- Condo– This data shows all the condominiums in Delaware that are illustrated by polygons.
- Address Point– This data has all the certified addresses in Delaware. This data helps with emergency response, accident reporting and more.
- Annexation– This is the annexation and conforming boundaries. This data goes back from 1853.
- Tax District– This data shows all the tax districts that are determined by the Auditor’s Real Estate Office. Data is updated on a need basis and published monthly.
- GPS– This file has data from 1991-1997 for the GPS monuments.
- School District– This data shows the school districts in Delaware. The data comes from the Delaware County Auditor parcel records.
- Zip Code– This shape file has all the zip codes in Delaware County. This shape file is published monthly to provide up to date information.
- Municipality– This is all of the municipalities in Delaware County.
- Subdivision– This data contains subdivisions and condos that are in Delaware County. Data is published monthly and updated daily.
- Building Outline 2021– This data has all of the building structures and was updated in 2021 and again in April 2023.
- Delaware County E911 Data– This data is to help with the emergency response and accident reporting for Delaware County. This data shows the coordinates in relations to 911 agencies.
- Township– This data is the 19 different townships that are in Delaware which are updated on a need-basis.
- Recorded Document– This data is compiled of various information from surveys to boundaries and housing classification. This data is published monthly with weekly changes.
- Farm Lots– This shows all the farm lots for the US Military and the Virginia Military Survey Districts.
- PLSS– This is the Public Land Survey System which shows the US Military and Virginia Military Survey Districts and certain boundaries.
- Dedicated ROW– This data has the right of way information within Delaware County.
- Hydrology– This data shows the major waterways in Delaware County.
