Chapter 4
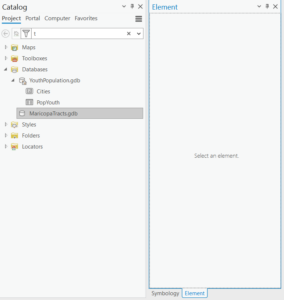
- 4.1-4.2: Incredibly confusing and frustrating, there were too many different instructions to browse to different folders that I didn’t even know existed or was extremely difficult to navigate this part Could not complete these parts as they all act as one part and towards the end of 4.1, the gdb files stopped displaying properly or were corrupted and I was unable to find the cause and didn’t want to restart after attempting to solve the problem for about three hours.
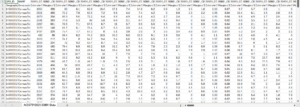
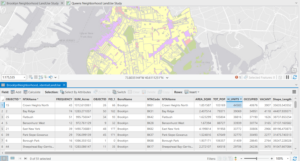
- 4.3: Still long and too many things to keep track of, but I was able to get an idea of creating data ranges. This part of the chapter also broke around ¾ of the way through though and despite doing what the instructions said verbatim, the attributes table was not displaying the correct numbers.
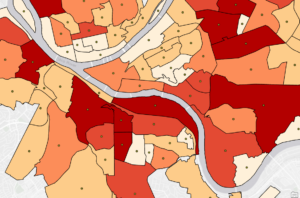
- 4.4: Short and to the point, a nice refresher from the other ones. I had forgotten how to make colored maps though so I had to relearn that part quickly.
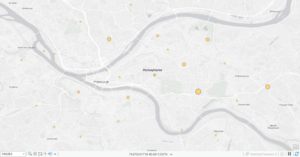
- 4.5: Easy to do, but I still don’t have a clue what a ‘centroid’ is given that the book doesn’t attempt to make any of the definitions in layman’s terms.
- 4.6: Discusses joining different datasets for use in tables. Again not entirely sure what that entails but I got it done somehow.
Chapter 5:
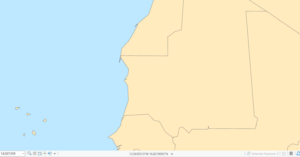
- 5.1: Discusses different coordinate systems used over time and how to change the appearance of a map based on the circumstances.
- 5.2: Very short, not entirely sure what changed by switching to the Albers equal area projection.
- 5.3: It is very interesting to see the opaque white layer over the actual map and watching where things such as roads and rivers intersect on the covering layer.
- 5.4: Adding the X/Y data was almost impossible as it’s listed elsewhere from what it says in the book. Seeing the completed overlay was interesting though.
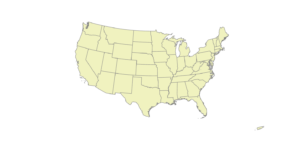
- 5.5: Discusses adding US census data to a table. Unable to finish as some of the listed excel files in the book did not exist in the file.
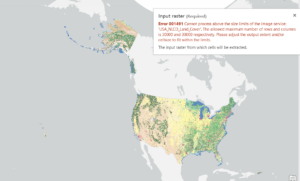
- 5.6: While using the raster data to create a legend of land use in the US was interesting, like several other chapter tutorials, this one also did not work as the Raster file was too large for the program to handle, even when extracting it from Living Atlas like the textbook instructed.
Chapter 6
- 6.1: Not particularly interesting nor did I really understand what the section was trying to teach me.
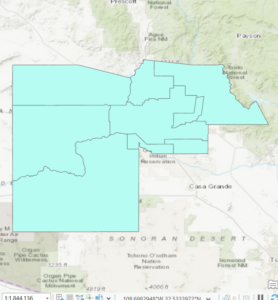
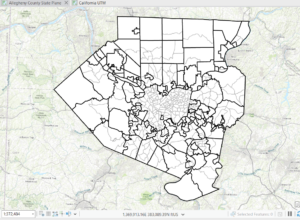
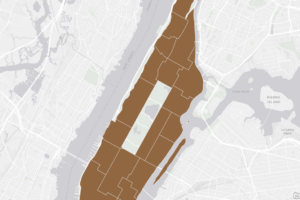
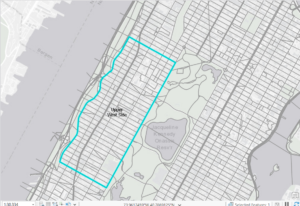
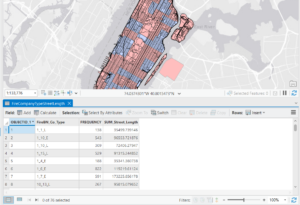
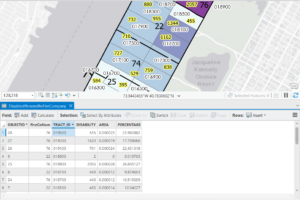
- 6.2: The select feature and seeing the outlined blue zones was interesting, but I did get stuck at the end when it wanted me to ‘select intersecting streets’.
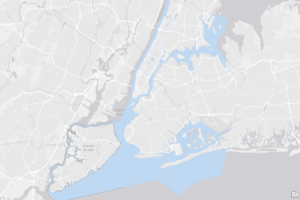
- 6.3: It is cool, if not somewhat satisfying, to be able to merge the individual water sections into one layer.
- 6.4: Short and to the point, I understand adding data to the attributes data as shown.
- 6.5: Another straightforward section in which I felt for the most part that I knew what was going on.
- 6.6: Aside from a small issue when joining the table, this section went fairly smoothly.
- 6.7: Very straight to the point, though I’m not entirely sure what changed or happened in this section.
Chapter 7
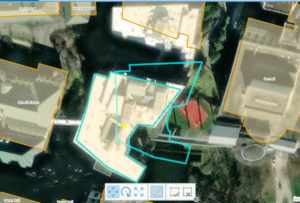
- 7.1: Short, straightforward, and easy to understand. Cool to be able to pick up a ‘location’ and move/rotate its outline to match with the structure.
- 7.2: Took a long time to figure out since there is no transparency slider but also making an outline isn’t as simple as connecting points as it creates an area for you so that required some trial and error. The snapping tool also did not match perfectly with the streets and only made straight lines.
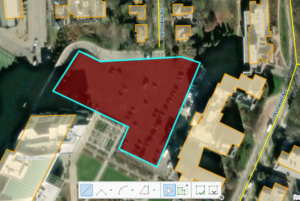
- 7.3: Very short and easy, not much else to say.
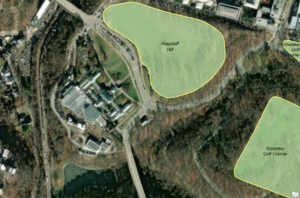
- 7.4: Took me way too long to figure out what I was doing with the linking but I got there. Also side note but the shown building has an uncanny resemblance to Stuy Hall.

Chapter 8
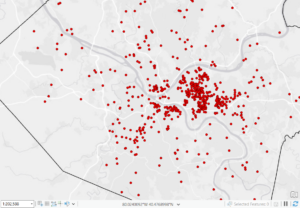
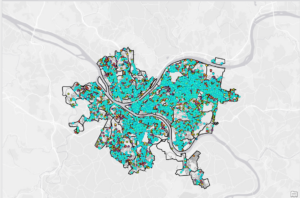
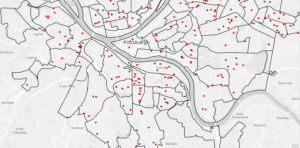
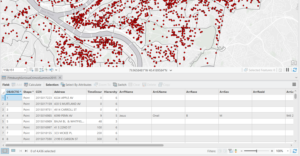
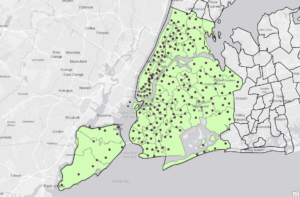
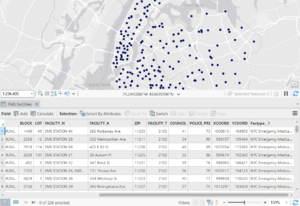
- 8.1: Had a couple of bumps getting to do what it wanted me to do but otherwise all was fairly straightforward. Interesting to see just how much data there actually is. Adding zip code dots to the map was also kinda cool as well as zooming out and seeing the overall map with all the red dots and clusters.
- 8.2: Followed on and expanded on some of what was done in the previous section. Again, lots of data to work with that makes it a little confusing. Not entirely sure what I did as it all felt somewhat like a repeat of 8.1