Chapter 1
- 1.1: Took forever to get things up and running, granted I can barely work a calculator, let alone a computer. Once things did work though, the introduction was simple and didn’t take long to finish.
- 1.2: Seeing the different variations and attributes are interesting, but it takes a long time to actually get there and get the different options selected or deselected.
- 1.3: While I do like to be able to see where the data comes from, there’s a lot of information and it takes a considerable amount of time to navigate through everything to get to the right thing.
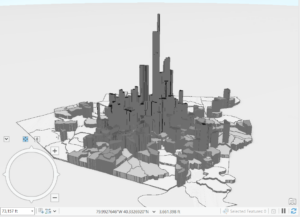
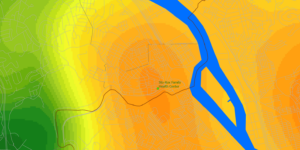
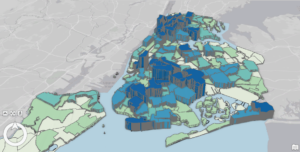
- 1.4: The 3D view and different symbols/colors for different areas are interesting, though figuring out how to vertically rotate the 3D view was a challenge.
Chapter 2
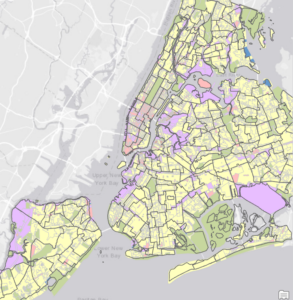
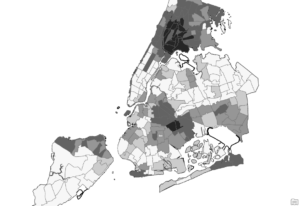
- 2.1: Changing the colors and the different options on the palette are cool, although the end result did not entirely look like the picture in the book.
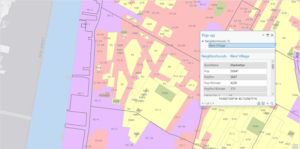
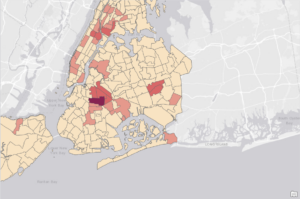
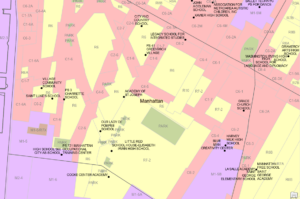
- 2.2: Section teaches how to label features and change labels. I was not certain I did it right though as no name popped up over the West Village area.
- 2.3: Slightly more time consuming than the others as changing from tab to tab to change color and symbol is fairly tedious
- 2.4: Initially broken at first as the neighborhood content section was corrupted and had to be repaired. Was also unclear in asking to move the one tab above the 3D section and not on top of it instead.
- 2.5: A short section but it did not work. There was no template section nor an area in which I could choose different shapes from as there was prior.
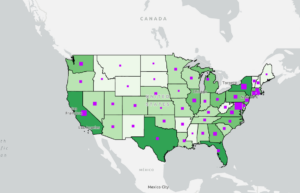
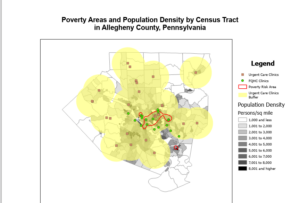
- 2.6: I suppose learning how to import layers is going to be important at some point. Splitting between the two layers was interesting to see though.
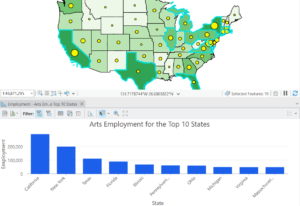
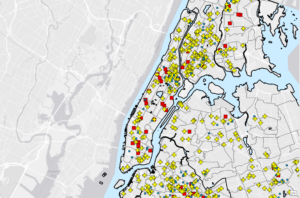
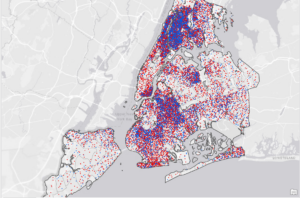
- 2.7: Short so not much to say for this one other than that there is something inherently satisfying about dot graphs.
- 2.8: Short but a little confusing as I thought for a minute I had done the same thing twice in a row
Chapter 3
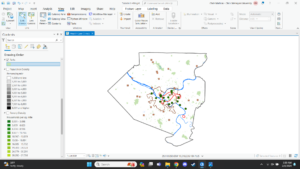
- 3.1: This one was a struggle to get through. Trying to get parts of maps and labels to snap to an axis was difficult, and a lot of different tabs to navigate through.
- 3.2: Now I’m even slightly more confused. Took me some time to figure out how to share it, but doing stuff on WebGIS rather than the actual program.
- 3.3: Took an extremely long time to do, and I’m not very confident in having my work shared online for all to see.
- 3.4: Shorter and a bit more clear in what it wanted, but halfway through I got stuck with the dashboard as I was unable to find the option to delete x and y value fields.