Chapter 1
1-1 — I do not have any questions or comments on this chapter overall. I am very confident in my computer abilities and knowledge, so learning this program has been very easy for me, as much knowledge has transferred over.
1-2 — This section was very simple and mostly just covered how to navigate the programs menus and maps.
1-3 — This tutorial was about learning how to use the attribute tables and the summary statistics tool to get statistical information from the map.
1-4 — This section was all about learning how to label things and add or change symbols for features. I could not get the 3d Map to open.
Chapter 2
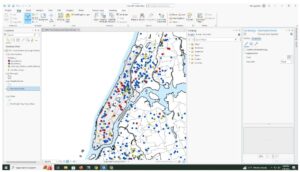
2-1 — This taught how to assign different colors to different feature classes.
2-2 — This taught how to label features and change the label properties. It also teaches how to manage pop ups when selecting a feature.
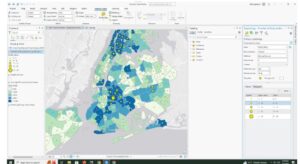
2-3 — I found the part regarding setting each symbol to a different shape and color tedious from previous sections, however knowing how to separate features based on other classifications is very useful.
2-4 — For this one, I ended up running into a problem where the source data was not set for the “Neighborhoods” layer, and I had to manually set it. Luckily, it was pretty easy to find it, because the file paths were all named logically.
2-5 — This was a very short section on a very simple concept that expanded off previous ones, just using symbols to explain
2-6 — Learning how to import settings from a different layer and apply the same parameters to another layer is incredibly useful for comparing the two layers.
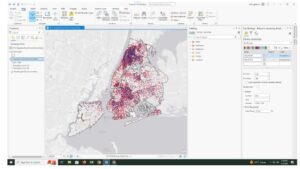
2-7 — This section showed how to use density dot maps, which is the other density map we learned of in the previous book.
2-8 — This taught how to adjust which features/labels can be seen from different zoom levels. This is very useful to prevent clutter, however I wish other virtual maps allowed me to change these min/max of visibility. I often find myself unable to determine what area of a map I’m looking at when zoomed too far in.

Chapter 3
3-1 — It’s strange, I feel, that map layouts were introduced at the very beginning and are not mentioned again until this point.
3-2 — Using WebGIS was a nice change of pace. I feel this is far simpler to navigate than Desktop, but it also feels more limited.
3-3 — I quite enjoyed being able to learn how to display my data in a meaningful and organized way, even if they did just tell me to copy and paste everything.
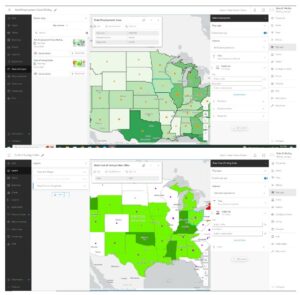
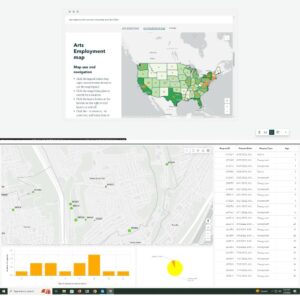
3-4 — This final section of this chapter was about how to create and assign data to graphs, charts and dashboards. It was quite interesting and at this point of the class it feels like we’re getting to the point where this information can really be applied to the real world and used in meaningful ways.