Hey there! I’m Fahad, a Computer Science and Data Analytics major. I am from Lahore, Pakistan.
It’s fascinating to see that geographers have mixed feelings about GIS, and I’m starting to get why after this intro. The impact of GIS on our modern world is huge, and being new to this field, I’m excited about how widely it can be applied. I’m still wrapping my head around the difference between spatial analysis and mapping, but it seems like there’s a lot of potential for pulling out different kinds of information. The whole concept of “black boxes” got me thinking – there are so many things in our lives that work in mysterious ways, and we just accept them without really understanding how they do what they do.
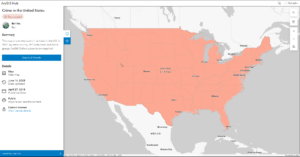
Diving into GIS applications, one area that caught my attention is the analysis of crime rates in the U.S. GIS enables the visualization and interpretation of crime data, offering valuable insights for law enforcement and policymakers. It goes beyond traditional statistical reports, providing a spatial perspective that can aid in identifying patterns, hotspots, and trends. I found a compelling map that illustrates crime rates in major U.S. cities, shedding light on the geographical distribution of criminal activities.
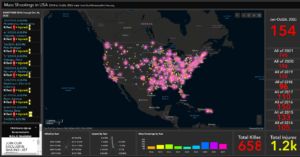
Another pressing issue that GIS can address is the analysis of mass shootings in the U.S. By mapping the locations, frequency, and other relevant factors, GIS plays a crucial role in understanding the spatial dynamics of these tragic events. Such analyses can contribute to developing strategies for prevention and response. A map depicting the occurrence of mass shootings across different states serves as a stark reminder of the need for comprehensive solutions.
https://www.arcgis.com/apps/dashboards/1e728cb3660f473fb4d00db8709d4f96