My name is Carsyn Hagans, and I am a sophomore majoring in biology and environmental science. I’m from Archbold, OH- which is a tiny village up in northwest Ohio (nearly in Michigan and Indiana). I love to travel, hike, read, drink coffee, and work out!
Over the summer, I did a research internship where they introduced me to some basic GIS concepts and ideas. We used ArcGIS to make a few maps, but I was given a very brief background on the creation of GIS as a field and its many uses today. I know GIS is becoming an increasingly more important and widely used tool in many careers, especially in environmental science. This first chapter gave me a a really good idea of how GIS came to be and how there are many different definitions of “GIS”. I had not really realized how many ways there are to utilize GIS, but the chapter brought up examples like soil chemistry, most successful stores, business routes, and crop blights all being represented through maps. When my family asks me what my GIS classes are, I usually just tell them that I’ll be making maps on computers, but this reading talks about how there’s more to it than that. GIS allows people to incorporate patterns and other trends into maps that give people a visual representation of the data. I truly think this is an important way to show data, and as the reading explains, people’s brains are much more equipped to interpret visual data. I am slightly confused about the “true” definition of GIS, as the reading introduces several different ways that professionals have defined it in the past. However, I think that because the reading does go back and forth between these varying definitions, it does portray the complexity of GIS and potentially even represent how people who are unfamiliar with GIS may become confused by it. That being said, I think this first chapter did a great job at introducing how multifaceted GIS is and giving us ideas on how businesses and organizations incorporate it into our everyday lives. I am excited to continue to learn about the ways in which we can utilize GIS to display important information.
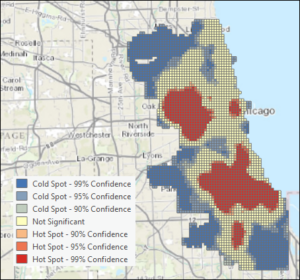
One interesting application for GIS I found on ChatGPT is crime mapping. It explained that law enforcement agencies can utilize GIS to map areas of high crime and then they are able to allocate more resources to these areas that would aid in crime prevention. This map is from ESRI/ArcGIS. It shows areas of high and low crime in the greater Chicago area. I think it’s interesting how they incorporated a confidence interval into the legend. (https://desktop.arcgis.com/en/analytics/case-studies/broken-bottles-3-pro-workflow.htm)
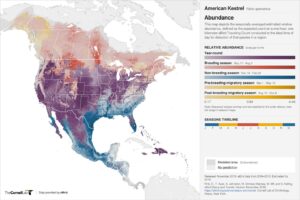
Another interesting application of GIS I found on Google is mapping animals’ migration patterns or geographical boundaries. I think an application like this would be very useful in the kind of career I want to pursue. Research scientists can take advantage of GIS to understand patterns found in the natural world. This map from ESRI shows the abundance of the American Kestrel during different times of the year, such as breeding or non-breading seasons. I like how much information this single map provides, as well as how it explains what it is showing. (https://www.esri.com/arcgis-blog/products/arcgis-pro/mapping/how-to-make-this-migration-map-and-why/)