Hello! My name is Jade Bryan and I am a freshman hoping to double major in Environmental Science and Anthropology. I am from Waco, Texas, but I have lived in Ohio for the past two years. I have experience in wildlife rehabilitation, but I am interested in learning more about botany and ecology. As for personal hobbies, I spend a lot of time on arts and crafts, as well as playing video games such as Minecraft, Hollowknight, Skyrim, etc. I hope to be able to learn and improve a lot over the course of this class! Also, the ‘r’ key on my laptop is broken, so I have to manually paste each one. Please forgive me if I miss any!
As someone unfamiliar with GIS, this chapter helped me understand a lot of the basic concepts of the software, as well as the history behind its creation and eventual widespread use. At first, I had thought GIS to just be fancy mapmaking, but now I am aware that its main purpose lies in analysis, which is more than any standard map can bring by itself. In addition, one of its main selling points is its versatility, as it can be used for anything from tracking animal populations to helping businesses understand their main demographics. However, because of this intense versatility, GIS has historically lacked much identity of its own. It is not just a specific software, but a specific approach; an approach that can be used by a variety of people in a variety of ways. Because of this, it has been hard to define over the past several decades. Even at its conception, it was marketed as a simple map making software, which is wholly undermining its value. This caused most of the mapmakers at the time to stray away from computerized GIS, and it has now only recently become fully appreciated. Personally, I found the figure of the cholera outbreaks to be very interesting. Because of our modern medical knowledge, it can be easy to forget that sewage wasn’t always known to be a key factor in many sicknesses. It’s extremely interesting to know that GIS was what helped people understand the correlation between pump location and disease outbreaks. Because of this, it’s very easy to see how this system could be absolutely game changing for the analysis of different fields. Personally, I would be very interested in using GIS in urban planning in order to introduce more fauna into the layout of cities and towns. I believe Delaware has actually done something similar, though I am unsure of the details of their use.
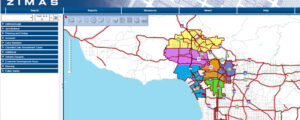
Speaking of urban planning, the city of Los Angeles has a public GIS map called the “Zone Information and Map Access System” (ZIMAS) in order to show city-zoning and land use information. This helps them with analysis and projections for a plethora of things, including housing and employment rate. https://planning.lacity.gov/blog/why-gis-technology-important-urban-planning
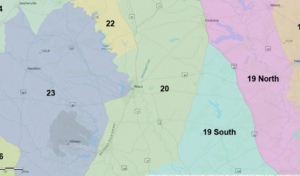
As someone from Texas, I know how important white-tailed deer are to my native state. Because of this, I thought it would be interesting to see if there have been any GIS maps created for the purpose of tracking them. There has been! While much simpler, this map at https://tpwd.texas.gov/arcgis/rest/services/Wildlife/TPWD_WL_WTDMU/MapServer shows the breakdown of different ecological zones based on soil, vegetation, land use, and deer population. While a much simpler map, it provides an interesting perspective on the diversity of Texas. Here is the map surrounding my home town of Waco, Texas.