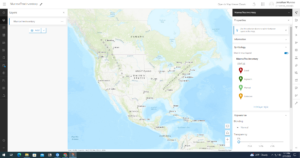
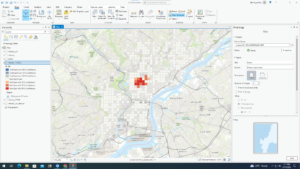
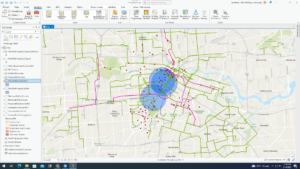
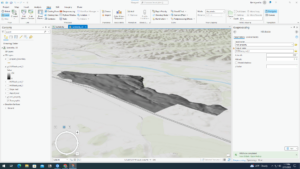
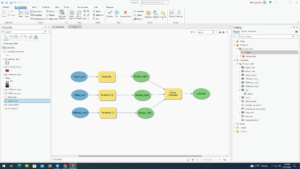
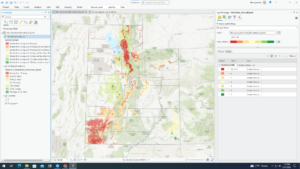
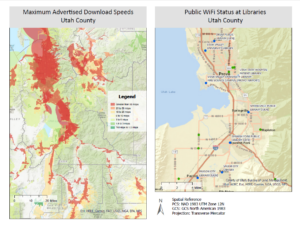
Chapter 6 went smoothly at the start, but soon failed me when I transferred the data to ArcOnline. I started by setting up a domain for a tree inventory, specifically classifying trees by planted, ingrowth, unknown and dead. I completed all of the symbology and fields on ArcPro and shared it as a web layer. Once I opened up the new layer on the map viewer, none of the trees showed up on the map (as seen in the first picture). This was disappointing but I was reassured that this was a recurring problem with other students and decided to skip over the rest of the chapter, which helped with the efficiency of getting the other chapters completed. Chapter 7 was a tad easier to complete, and while there were a few roadblocks I managed to finish the chapter and produce a map somewhat like the one featured by the author. This chapter worked with preparing project data by joining a table and managing symbology, geocoding location data through address locator and rematching addresses, and using geoprocessing tools to analyze vector data. This included creating buffers, merging and dissolving features, clipping features, selecting by attribute and location and creating a spatial join. I thought it was beneficial that this chapter focused on correcting data. From personal experience, I’ve had many mess ups on my data and it’s very helpful to have guidance through these issues. After correcting data, I was able to produce a map of Houston showing zoning districts, bike lanes and potential retail sites. This exercise reminded me of a lab in remote sensing involving selecting a potential home for Dr. Rowley in Delaware. Chapter 8 also gave me problems, and I tried three times to make the data work but was unsuccessful. The purpose of this chapter is to create a kernel density map, perform hot spot analysis, explore the results in 3D and animate the data. I was able to narrow down robberies in January 2014 Philadelphia and use that to create a kernel density map and create a hotspot analysis but was unable to continue with a space time cube. My map (as shown below) had hot spots drawn to a bigger size which didn’t have enough data to produce the space time cube. I then went on to the next chapter. Chapter 9 was focused on mapping a winery with preparing data, deriving new surfaces and creating a weighted suitability model. I was also familiar with some of the exercise with refreshers from remote sensing, in particular creating a mosaic raster and deriving hillshade and slope. I had no big issues with this chapter and was able to zip by pretty quickly. I did have a final issue at the end with my model when I couldn’t find the model raster in my geodatabase. Luckily this was the final step and Krygier let me off the hook. Lastly, chapter 10 encompassed all of the steps of GEOG112. This chapter was concerned with applying detailed symbology, labeling features, creating a page layout and sharing the project. I found this chapter to be rewarding as it makes me happy to have a final copy of a map I created. I think this was pretty self explanatory and a good refresher of everything basic covered in the book. I didn’t have any issues with this chapter but I did think that the second map on the page (the one of Provo) should’ve had a legend to explain the points on the map. I’m happy to be done with this book but I think it will also be beneficial to retouch on some of the chapters I had issues with, as I’m always trying to improve my skills in GIS.
Yeah, weird errors but even in those cases I hope you get a sense of what they should be doing and how you might use them. Excellent on the other stuff.