Getting To Know ArcGIS by Michael Law and Amy Collins
Chapter 1: Introducing GIS
Notes and Comments
- A GIS is composed of five interacting parts that include hardware, software, data, procedures, and people.
- Spatial data—…information that represents real-world locations and the shapes of geographic features and the relationships between them—involves using coordinates and a suitable map projection to reference this data to the earth (e.g., the location of a hospital).
- Attribute data—information about spatial data (e.g., information about the hospital).
- Dynamic and interactive maps on the internet, known simply as web maps, are ideal for allowing many users to access and quickly locate features and visualize data.
- The open data movement provides agencies and the public with authoritative data and enables all levels of government to develop new tools and applications.
- Point, line, and polygon data is also called vector data.
- Features of the same type—such as trees, roadways, or buildings—are grouped together and displayed as layers on a map.
- You can record and collect measured values for any location on the earth’s surface to form a digital surface, also known as a raster.
- ArcGIS Pro uses ArcGIS Online basemaps, which provides a backdrop or frame of reference as you add your own layers.
Exercise Notes and Screenshots
- Pay attention to the names of each subject—some of them are very similar.
Getting To Know ArcGIS by Michael Law and Amy Collins
Chapter 2: A first look at ArcGIS Pro
Notes and Comments
- It offers 2D and 3D visualization and analysis within an intuitive, easily navigable interface
Exercise Notes and Screenshots
- Using a project template (.aptx) is usually the quickest way to start a project. Templates are shareable project packages, including the specific basemaps, connections, datasets, toolboxes, or add-ins that are most helpful for your project.
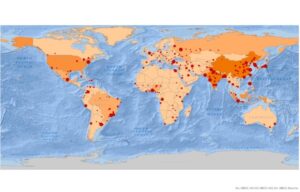
- The countries with the highest PM concentrations are Uruguay, Angola, Sudan, Chad, Niger, Mali, Iraq, Egypt, Pakistan, and Bangladesh.
- If the content pane is missing, I utilize the search bar to return it.
- The city with the largest population is Shanghai, China.
- Symbology refers to the way GIS features are displayed on a map.
- Single symbol—one symbol is used for all features in a layer.
- Unique values—used for categorical data, different symbols represent various attributes.
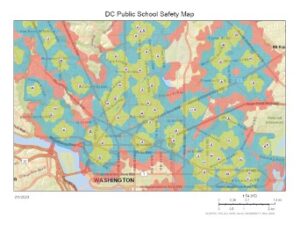
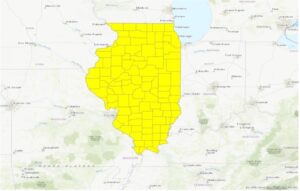
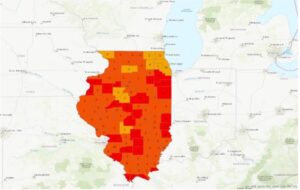
- Graduated colors—used for quantitative data, different colors represent different value ranges.
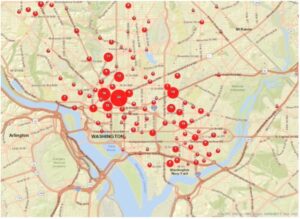
- Graduated symbols—used for quantitative data, symbols increase in size with increased values.
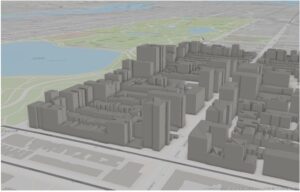
- The height of the tallest building is 339.8 meters.
- Extrusion is the process of stretching flat 2D features vertically so that they appear three-dimensional.
Getting To Know ArcGIS by Michael Law and Amy Collins
Chapter 3: Exploring geospatial relationships
Notes and Comments
- The power of GIS extends far beyond exploring digital maps. You can combine datasets, enrich them with new attributes, derive statistics from them, and obtain new information based on their relationships.
Exercise Notes and Screenshots
- The field name that indicates the state within which the county features are located is “STATE_NAME.” In Wayne, Ohio there is 10,575 people between the ages of 22 and 29 years.
- Definition queries are helpful when you want to work with a subset of data in a map while maintaining the source data.
- Attribute query—a request for features in a table that meet user-defined criteria.
- Using an attribute join operation, you can append the spreadsheet table (the join table) to your existing attribute table (the input table), provided you have a common attribute field in each table—for instance, a feature name or numerical identifier.
- I cannot find the years of data that are represented in the table.
- There are various classification methods:
- Manual interval classification, equal interval classification, defined interval classification, quantile classification, natural breaks (jenks) classification, geometric interval classification, and standard deviation classification.
- I was not able to verify a correlation between income and 2010 obesity. I believe I messed up with importing symbology from 2009 to 2010.
- The percentage of households that had income of less than $15,000 per year is 17.7%.
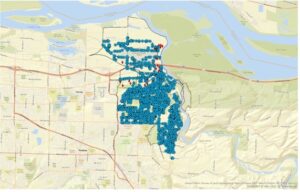
- There are 13,115 food deserts in Knox County.
- A spatial join allows you to define a spatial relationship between two layers (a target layer and a join layer) and combine their attributes in a new output layer.
Getting To Know ArcGIS by Michael Law and Amy Collins
Chapter 4: Creating and editing spatial data
Notes and Comments
- A shapefile is a simple, stand-alone data format. It stores geometry and attribute data for one set of features.
- A geodatabase is a storage container, in which sets of features are grouped into feature classes. The geodatabase can also store rasters and special geodatabase elements that facilitate capabilities that are not available with other data formats.
Exercise Notes and Screenshots
- A coordinate system defines features’ positions on the earth’s surface.
- A geographic coordinate system uses latitude and longitude to define the locations of points on the surface of a sphere or spheroid.
- A projected coordinate system uses a mathematical equation (the map projection) to transform latitude and longitude coordinates into Cartesian or planar coordinates for display on a flat map.
- ArcGIS employs on-the-fly projection, which means that it applies the projected coordinate system of the first layer added to all subsequent layers.
- Metadata is textual information about the dataset.
- An attribute domain is a set of valid values, or a numerical range, to which attributes in each field must be limited.
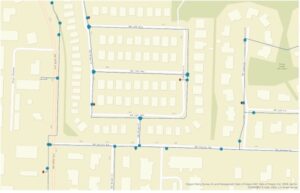
- Snapping allows you to accurately connect features, such as waterlines and values, without impossibly precise sketching.
- There are four vertices on SW 19th
- The Shape_Area value of the original water pressure zone split in half.
Getting To Know ArcGIS by Michael Law and Amy Collins
Chapter 5: Facilitating workflows
Notes and Comments
- A task item might capture an entire workflow or one piece of a more complex solution.
- Modelbuilder is a geoprocessing environment that allows you to easily link one tool to another and run a set of operations one after another with the click of a button.
Exercise Notes and Screenshots
- Tasks are helpful to standardize business operations and promote best practices for a repeatable workflow.
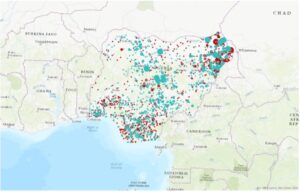
- Yes, I can name the types of conflict events that are recorded in this dataset.
- A definition query limits the display of features to features that meet user-defined criteria.
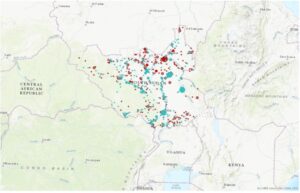
- According to ACLED statistics, 14,211 fatalities resulted from conflicts against South Sudanese civilians between 2010 and 2018.
- A model allows you to string multiple geoprocessing tools together and run them automatically with the click of button.
- There were 71 fatalities that resulted from conflicts classified as violence against civilians in Rwanda from 2010 to 2018.
- There were 41 events classified as riots/protests that occurred in Rwanda between 2010 and 2018. As a result of these events, there was 12 fatalities.
- Python is a programming language that, in the GIS context, is used to script geoprocessing workflows and build custom geoprocessing tools.
- The two geoprocessing tools that are combined in this script are Select and Summary Statistics.
- There were 26,323 fatalities that resulted from conflicts classified as violence against civilians in Nigeria from 2010 to 2018.
How are you getting through with so few errors? Or maybe you just didn’t mark them down? In any case, excellent romp through the tutorial. You get the concepts and the details of how to make the software do stuff.