
Nair – Finals
Final:
- For the final project, I chose Chapter 5 which is based on Geoprocessing with Python
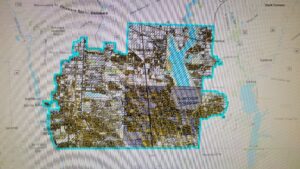
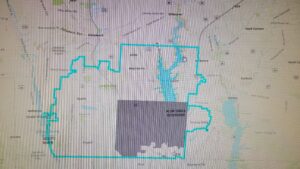
- Here, I used the dataset from my 191 Finals and hard-coded the “Clip – Analysis” tool for the Olentangy School District. I clipped all other (four) shapefiles to fit into this district, so only the data from this particular area could be seen
- I had no motives for doing so except to see how these data files intersect and if I can actually put into use whatever I’ve learned from the chapter.
- Having the dataset from 191 helped as I was just redoing the project in a much more elaborate way without using tools that were developed by some other programmer but by using my own code.
- Here are some of my pictures: (Forgot to take them while I actually did this so I had to re-do it, in order to get “proof” that I actually did it):
- For the second chapter I chose Chapter 6, I know you said they need to be between 1-4 and 5-8 but I found 5 and 6 the only ones to be actually application based.
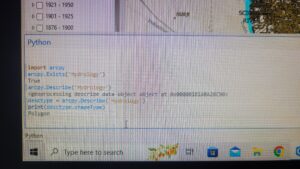
- Chapter 6 is based on Exploring spatial data so I started by using functions like Exists, and Describe to get started.
- Exists returns true and false depending on if a dataset exists and describe, describes the data set of a file. A function shapeType can also be used with Describe the shape type of a dataset.
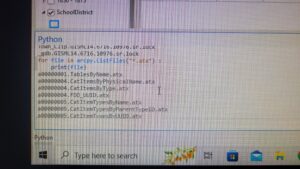
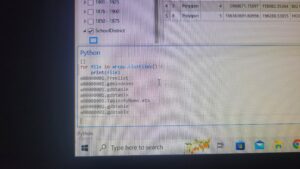
- I also played around with List_Fields() and List_Files.
Here are the pictures for that:
I enjoyed taking this class a lot! Overall, I didn’t have much trouble completing tasks except getting the Python Terminal set up. One piece of advice I would have would be for prospective students to take 191 before GIS 193. That class helped me a lot with understanding GIS concepts before I learn how to use Python to implement them.
Nair – Week 6
Chapter 7:
- This chapter was mainly about debugging and how to fix errors when coding.
- I have done this before my computer science classes, and debugging has become an easier task for me now.
- I’ve already been taught a lot of the techniques mentioned in the chapter through my professors so I was able to get through this chapter easily.
Chapter 8:
- This chapter was about manipulating spatial and tabular data and using concepts learned in past chapters for application.
- I also came across the term cursor – a database technology term for accessing a set of records in a table, and its types( search, insert, update)
- These functions are essentially used to insert, update, or search things through tables.
- The Cursor also has other functions like delete and reset.
- The chapter also talks about working with SQL expressions and text and CSV files.
- I’m still learning SQL so it took me a while to understand the syntax
- It is also interesting to learn that a lot of these tools that we used for GIS 191 and 192 are made using Python.
Nair – Week 5
Chapter 5:
- This chapter introduces ArcPy and geoprocessing using Python
- I began with setting up my workspace which I had done before for GIS 191
- The textbook also mentioned detailed changes to the environment like the env size, XY tolerance, etc.
- The chapter mentioned that the key to getting the tool to run right is to get the parameters right.
- Usually, they are just: input datasets, tool features, and output datasets
- Optional parameters are enclosed in {}
- I ran the Clip feature using the syntax instructions given in the textbook.
Chapter 6:
- This chapter was all about exploring spatial data
- This chapter introduced some new functions in ArcPy, and also how to perform batch processing more efficiently.
- ArcPy has list functions that include: ListFields(), ListIndexes, ListDatasets(), ListWorkspaces(), and ListVersions()
- I also noticed that some of the function names had been changed in ArcGIS Pro when compared to the textbook.\
- The chapter also mentioned some built-in functions for lists that were mentioned in Chapter 4 before like len(returns the length of the list), sort(sorts the list), etc.
Nair – Week 4
Chapter 3:
- The chapter gets started with geoprocessing and how to use it in parallel with the Python Window.
- Getting the Geoprocessing pane to open and understanding how it works was easy for me as I’ve used some of the tools for GIS 191
- I came across three different types of tools:
- Built-in tools: Built with compiled programming languages like C++ For example The Clip Tool
- Script Tools: Built using scripting languages like Python. For example Mean Center.
- Model Tools: Built using models like Model Builder. For example My Model
- The dialog box is also something that I’m well acquainted with due to GIS 191
- I also used a map from one of the GIS 191 databases to try the “Clip” and “Intersect” tools
- I also came across the Environment Settings in the Analysis Tab, which can be specified for better efficient usage of the tools.
- These environment settings can be coded, or used through individual tools as well \
- I also came across Batch Processing, which is running the same tools multiple times with different parameters. Dynamic naming of the tool’s output datasets must receive special consideration so that a unique name is used for every iteration of the batch tool. Batch tool outputs are dynamically named using the %Name% variable in output parameters.t
- Batch mode can also take in multiple raster variables and determine multiple statistics in one go
- Then I used the Model Builder. I had used this before for GIS 191. Unfortunately, the dataset I was using did not have variables of different kinds, which posed a problem in connecting the shapes, I believe, But I did not fret about it as I had done this before.
- For scripting, I noticed that some of the ways, the code for Clip(Analysis Tool) worked had been changed.
- I just had to mention the input layers when I used Clip and the output name, and it gave back the perfect result when I ran the code
- I also saw the Python Code for “Split By Attribute” in the Analysis Toolbox, which was really cool.
Chapter 4:
- The 4th chapter is about learning how Python works and its syntax
- This chapter was a bit easy for me because I’ve done Python before and only had to review some stuff to get started
- I also came across Unicode (which helps you print out special characters that might not be in English) which I hadn’t before.
Nair – Week 3
Chapter 1:
- The chapter mentions Python as a “scripting language” more than a programming language. Although I’ve seen this word around a lot in the CS Jargon, I haven’t really understood what it meant. The book mentions a clear distinction between the two.
- The chapter also has a structure mentioned, as in a brief of what each chapter in the book entails, and that gives me a clear idea of what I’m going to be doing this semester.
- It also mentions the advantages of using Python instead of just relying on the tools offered by ArcGIS Pro.
- Was a very laid back introduction to using Python in ArcGIS Pro, and gave me a gist of what I was getting myself into.
Chapter 2:
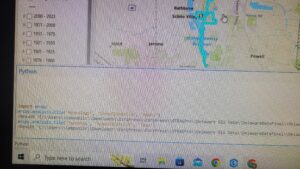
- I had trouble as soon as I started. The Python Command Line doesn’t work or show the same things as the textbook. I tried to get the Command Line(Prompt) and IDLE started but wasn’t able to. I got the following error, every time I tried to run:
- Traceback (most recent call last):
- File “<pyshell#4>”, line 1, in <module>
- print(numpy._file_)
- AttributeError: ‘module’ object has no attribute ‘_file_’
- >>>
- I think downloading PyCharm might work? Not sure
- I got through it! The Python Window in ArcGIS Pro worked in the end and I did not need to download PyCharm as well.
- The Python Window can be accessed by:
- (Assuming you have a map opened) → View Tab → Python Pane. (It should show up at the bottom)
- The second chapter was an introduction to different types of Python IDEs and environments that can be used to go through with the book. Choosing the Python Window would be better in my opinion since there would be no need for extra downloads.
I got through the first chapter in 20 minutes, however it took some time for the second one. But, I think now that I have figured this out, there should not be much trouble.
Nair – Week 1 & 2
So excited to be in this course!! I decided against posting a picture of mine, since it’s already there somewhere on the 191 site, here’s another gorgeous picture:

Geography 193 GIS & Python, 2nd mod., Spring 2023 Updated

I’ve updated the course syllabus and schedule for this course, Geography 193: Geospatial Analysis with Python for Module 2 of the Spring ’23 semester. The dates are: 3/8/2023 – 4/3/2023.
This is largely an independent study, using a tutorial to learn about Python and ArcGIS software (online and desktop).
As with other courses in this sequence (Geog 191, Geog 192) the idea is to have a flexible but structured course that fits into your schedule. Please be flexible with the tutorial – it will undoubtedly be a bit out of date, or something may not work the way it should. Give it a try and move on if its just not functioning.
McConkey: Course Wrap Up
Python Scripting for ArcGIS Pro
The book is helpful to start to get an understanding of Python, but it is difficult to interpret sometimes as it is prone to using jargon. It does define the jargon, or scripting terms, and explain how the terms relate to each other, but it does get confusing sometimes if you are unfamiliar with a lot of these concepts. The weakest part of the book is that it reads like a walkthrough, but there is no actual data package that comes with it so you are not able to perform all of the scripts it explains. Although the book works as a learning tool, I believe it works better as a reference guide.
Individual Project: ERSI Learning Courses
Even though I was not able to make as much progress as I wanted with the ESRI learning course, I do think the courses make it easier to learn Python much more than the book as you are able to actively learn through working with datasets and writing scripts. Additionally, you are immediately able to see the results of your scripts which makes you feel much more accomplished. There are many learning courses that you should be able to access and many of them are introductory level courses. The directions for the learning courses that I worked through were pretty thorough, so the biggest learning curve comes from navigating PyCharm than writing the code itself.
The work that was completed was certainly worthwhile; however, I hit an error that caused more errors and delays which prohibited me from completing the second learning course I was on. The main error occurred after I added a python interpreter to PyCharm as instructed in the “Python Scripting for Geoprocessing” course. After the interpreter was added and I ran the completed code and an error code appeared in the console. It reads as follows: C:\Program Files\ArcGIS\Pro\bin\Python\envs\arcgispro-py3\lib\site-packages\numpy\__init__.py:143: UserWarning: mkl-service package failed to import, therefore Intel(R) MKL initialization ensuring its correct out-of-the-box operation under condition when Gnu OpenMP had already been loaded by Python process is not assured. Please install mkl-service package, see http://github.com/IntelPython/mkl-service from . import _distributor_init
I tried following the link but that lead to many dead ends. I also discovered that PyCharm stopped recognizing arcpy as a module around this time. This may have been from the version of Python I was using but after I tried changing it, the error still appeared.
I then tried following the file path listed in the error code: “C:\Program Files\ArcGIS\Pro\bin\Python\envs\arcgispro-py3\lib\site-packages\numby\__init__.py:143.” I could not find “__init__.py:143” in the numpy folder.
I went to the settings and clicked on the Python interpreter and saw that the packages are actually listed. I found the mkl-service package in the list so I wasn’t sure why it wasn’t working. I clicked the plus sign to add a package, searched for the mkl-service package, and clicked install. However, an error occurred claiming that I did not “have the write permissions to the target environment.
I worked with someone from OWU tech support and we discovered that I did have administration access and we tried a couple of alternative methods but determined that the error may stem from a problem with the actual PyCharm software itself. Hopefully, you don’t encounter any of these errors as they are a pain to deal with.
Overall, I am proud of the work I was able to complete. I definitely think the learning courses are worth exploring and should maybe be the primary focus of the course, rather than reading the book. I think I retained knowledge better from the courses than from the book itself, but this could be a reflection of my learning style. The book is still a worthy investment. Taking down notes will slow your progress, but they definitely will help you retain more information.
McConkey: Python Scripting for Geoprocessing (ERRORS)
Right off the bat, this course seems to cover directions in more detail than in the last course, Python for Everyone. I would actually recommend taking this course first so you can better interpret the directions of the other course. That is of course if you don’t encounter the same errors I came across. Sadly, I was not able to complete this course during the semester as I could not fix these errors.
Errors:
In the first exercise, an error may occur at step 5 when setting the environment for the script. When you set the Python Interpreter an error message may pop up in the Python console. It appears as written below (you may have to scroll to read the whole thing):
C:\Program Files\ArcGIS\Pro\bin\Python\envs\arcgispro-py3\lib\site-packages\numpy\__init__.py:143: UserWarning: mkl-service package failed to import, therefore Intel(R) MKL initialization ensuring its correct out-of-the-box operation under condition when Gnu OpenMP had already been loaded by Python process is not assured. Please install mkl-service package, see http://github.com/IntelPython/mkl-service
from . import _distributor_init
Basically, it wants you to install something called an “mkl service package.” I discovered if you go into the settings and look at the interpreter there is actually an add (plus sign) button that you can add packages. I clicked the add button and made a search for the mkl service package. When I found it I pressed install but some type of administration error occurred. The error may be from the version of Python that you are using so you might have to do some research to find what version of Python works with ArcPro, which I believe is Python 3.7. I also tried to download this version but I am not sure if it was actually successful.
The script for exercise 1 should look like this:
import arcpy
# Set environments
arcpy.env.workspace = r"C:EsriTraining\PythonGP\Data\SanJuan.gdb"
arcpy.env.overwriteOutput = True
# Set parameters used to join the BufferDistance table to the Roads feature class
inFeatures = "Roads"
inField = "ROUTE_TYPE"
joinTable = "BufferDistance"
joinField = "ROUTE_TYPE"
# Script Joins table to feature class
arcpy.JoinField_management(inFeatures, inField, joinTable, joinField)
# Set parameters used to buffer Roads feature class
outBuffers = "RoadBuffers"
buffField = "DISTANCE"
# Buffer the roads based on DISTANCE attribute
arcpy.Buffer_analysis(inFeatures, outBuffers, buffField)