McConkey: Course Wrap Up

Python Scripting for ArcGIS Pro

The book is helpful to start to get an understanding of Python, but it is difficult to interpret sometimes as it is prone to using jargon. It does define the jargon, or scripting terms, and explain how the terms relate to each other, but it does get confusing sometimes if you are unfamiliar with a lot of these concepts. The weakest part of the book is that it reads like a walkthrough, but there is no actual data package that comes with it so you are not able to perform all of the scripts it explains. Although the book works as a learning tool, I believe it works better as a reference guide.

Individual Project: ERSI Learning Courses

Even though I was not able to make as much progress as I wanted with the ESRI learning course, I do think the courses make it easier to learn Python much more than the book as you are able to actively learn through working with datasets and writing scripts. Additionally, you are immediately able to see the results of your scripts which makes you feel much more accomplished. There are many learning courses that you should be able to access and many of them are introductory level courses. The directions for the learning courses that I worked through were pretty thorough, so the biggest learning curve comes from navigating PyCharm than writing the code itself.

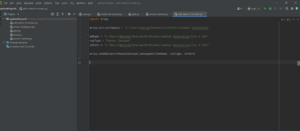
The work that was completed was certainly worthwhile; however, I hit an error that caused more errors and delays which prohibited me from completing the second learning course I was on.Ā  The main error occurred after I added a python interpreter to PyCharm as instructed in the “Python Scripting for Geoprocessing” course. After the interpreter was added and I ran the completed code and an error code appeared in the console. It reads as follows: C:\Program Files\ArcGIS\Pro\bin\Python\envs\arcgispro-py3\lib\site-packages\numpy\__init__.py:143: UserWarning: mkl-service package failed to import, therefore Intel(R) MKL initialization ensuring its correct out-of-the-box operation under condition when Gnu OpenMP had already been loaded by Python process is not assured. Please install mkl-service package, see http://github.com/IntelPython/mkl-service from . import _distributor_init

I tried following the link but that lead to many dead ends. I also discovered that PyCharm stopped recognizing arcpy as a module around this time. This may have been from the version of Python I was using but after I tried changing it, the error still appeared.

I then tried following the file path listed in the error code: “C:\Program Files\ArcGIS\Pro\bin\Python\envs\arcgispro-py3\lib\site-packages\numby\__init__.py:143.” I could not find “__init__.py:143” in the numpy folder.

I went to the settings and clicked on the Python interpreter and saw that the packages are actually listed. I found the mkl-service package in the list so I wasn’t sure why it wasn’t working. I clicked the plus sign to add a package, searched for the mkl-service package, and clicked install. However, an error occurred claiming that I did not “have the write permissions to the target environment.

I worked with someone from OWU tech support and we discovered that I did have administration access and we tried a couple of alternative methods but determined that the error may stem from a problem with the actual PyCharm software itself. Hopefully, you don’t encounter any of these errors as they are a pain to deal with.

Overall, I am proud of the work I was able to complete. I definitely think the learning courses are worth exploring and should maybe be the primary focus of the course, rather than reading the book. I think I retained knowledge better from the courses than from the book itself, but this could be a reflection of my learning style. The book is still a worthy investment. Taking down notes will slow your progress, but they definitely will help you retain more information.

McConkey: Python Scripting for Geoprocessing (ERRORS)

Right off the bat, this course seems to cover directions in more detail than in the last course, Python for Everyone. I would actually recommend taking this course first so you can better interpret the directions of the other course. That is of course if you don’t encounter the same errors I came across. Sadly, I was not able to complete this course during the semester as I could not fix these errors.

Errors:

In the first exercise, an error may occur at step 5 when setting the environment for the script. When you set the Python Interpreter an error message may pop up in the Python console. It appears as written below (you may have to scroll to read the whole thing):

C:\Program Files\ArcGIS\Pro\bin\Python\envs\arcgispro-py3\lib\site-packages\numpy\__init__.py:143: UserWarning: mkl-service package failed to import, therefore Intel(R) MKL initialization ensuring its correct out-of-the-box operation under condition when Gnu OpenMP had already been loaded by Python process is not assured. Please install mkl-service package, see http://github.com/IntelPython/mkl-service
from . import _distributor_init

Basically, it wants you to install something called an “mkl service package.” I discovered if you go into the settings and look at the interpreter there is actually an add (plus sign) button that you can add packages. I clicked the add button and made a search for the mkl service package. When I found it I pressed install but some type of administration error occurred. The error may be from the version of Python that you are using so you might have to do some research to find what version of Python works with ArcPro, which I believe is Python 3.7. I also tried to download this version but I am not sure if it was actually successful.

The script for exercise 1 should look like this:

import arcpy
# Set environments
arcpy.env.workspace = r"C:EsriTraining\PythonGP\Data\SanJuan.gdb"
arcpy.env.overwriteOutput = True
# Set parameters used to join the BufferDistance table to the Roads feature class
inFeatures = "Roads"
inField = "ROUTE_TYPE"
joinTable = "BufferDistance"
joinField = "ROUTE_TYPE"
# Script Joins table to feature class
arcpy.JoinField_management(inFeatures, inField, joinTable, joinField)
# Set parameters used to buffer Roads feature class
outBuffers = "RoadBuffers"
buffField = "DISTANCE"
# Buffer the roads based on DISTANCE attribute
arcpy.Buffer_analysis(inFeatures, outBuffers, buffField)


ArcPy Final Assignment

Mack Wade


Get Started with Python in ArcGIS Pro

In this course I learned how to write code to determine the number of features for all the feature classes in a workspace. This course also introduced some of the basics of Python syntax as I wrote code into the Python window in ArcGIS Pro.Ā Ā 

In order to begin this project I had to download data from ESRIā€™s website. I really enjoyed this course and chose to do it because of the downloadable data that I could use as I followed along, unlike the book which did not provide downloadable datasets for itā€™s walkthroughs.Ā 

The course provided a few shapefiles to work out of, but for this exercise I used the Ambulances.shp.Ā 

First, I ran a tool using Python. In Arc there are many ways and routes to complete one task. This task was to find the count of the items in the shapefile. You can do this in the attribute table or by using the Get Count tool in the Toolbox. You can also find the count by running a script in the Python window.Ā 

To do this you take go to the toolbox history > right click the Get Count tool > Send to Python Window. After sending the window, I manually entered ā€œAmbulancesā€ since thatā€™s the shapefile I want to be working out of. The script looked like this:

arcpy.management.GetCount(“ambulances”)

After completing this task, I learned that when completing a script in the Python window, the history is updated to include the task.Ā 

The next task that I practiced was inputing an assignment statement.Ā 

y = 73Ā 

Then,Ā 

x = 37

Then,

x * yĀ 

Then, after pressing enter, the Python window answered with 2701

Next, I did a similar thing but with Temperature.Ā 

temp_c = 17

temp_f = temp_c * 9 / 5 + 32

print(temp_f)

The Python window responded with 62.6

The next assignment was learning how to use the Python window as a tool to help you when writing code. You can do this by hovering over the prompt and reading the information that the window provides.Ā 

There is also a system of code completion. For example, if you want the ā€œGet Countā€ tool, you can typer ā€œGetā€ in the Python Window and suggestions will pop up to help you finish the prompt easier.Ā 

I really enjoyed this tutorial. I thought that it was very easy to follow and was helpful. I see myself using more of ESRIā€™s resources in the future if or when needed when writing scripts. I think that if any student was interested in this course in the future these tutorials would be a better resource than the book we used.

I had some screen shots from this assignment but they did not get added into the blog format. If you would like me to send those over to you. let me know.

Frawley: R Geospatial Wrap Up

Background ā€”Ā 

This independent study was more so learning R rather than spending more time in project-based learning as I did with python. R is a very powerful data-driven language and is great for using large data sets. R is vastly used for geospatial analysis as well. I created a county population map of the United States using census data from built-in libraries whose primary use is for geospatial analysis. The code looks very simple, but it was not. I had significantly more problems with R than I did with Python. The syntax used in R is an absolute cluster and I despise it.Ā 


StepsĀ 

  1. Import libraries usmap and ggplot2.Ā 
  2. Add some data to plot the map, data = countypop draws the county lines and values creates data with the built-in census data via a CSV.Ā 
  3. Create a scale and create breaksĀ 
  4. Change the scale fill to one thatā€™s not a constant color for easier viewing
  5. Cry because you canā€™t create an interactive map with tmapĀ 


The Code ā€”Ā 

library(usmap)

library(ggplot2)

plot_usmap(data = countypop, values = “pop_2015”, color = “grey”) +Ā 

Ā Ā scale_fill_viridis_c(name = “County Population 2015”, label = scales::comma, option = ‘D’, trans = “log2”,Ā  breaks = trans_breaks(“log2”, function(x) 2^x))+

theme(legend.position = “right”)


Problems ā€”Ā 

Like I stated before, I had tons of issues with this project. I programmed the map at least 15 different ways and it never looked like how I wanted it to. I think R is a little over my head when it comes to the math-based stuff like the scale. The breaks were never how I wanted them but I chose one that seemed the most reasonable.

Ā Another issue that I had was this map is a static map, it cannot move and you cannot click on counties to see their population. I tried for at least three weeks to create an interactive map through the library T map. Itā€™s literally very simple, you just join the counties and the county population CSV to create the interactive map. The issue that I had was joining the two tables by their geoID. It never seemed to work and I literally even created my own spreadsheet with the countiesā€™ populations, names, states, and geoID. Didnā€™t work. This was the most frustrating part of the project that I dealt with.Ā 

Again, I took more of a book approach to this course so it definitely felt like I couldā€™ve figured it out by making other things within R. I can follow the code and see what someone is doing, but trying to do it on your own starting out is very difficult. Also, R is just way worse and not as user-friendly as Python. I feel that I could definitely become better at R if I just spent more time with it, and also brushed up on my math skills a little more.Ā 


Frawley: Python Wrap Up

Background – Ā  Ā For this independent study, I wanted to solve a problem that isnā€™t necessarily tedious but just annoying. For me, that was creating true color images through ArcPro. Working with Dr. Rowley has made me quite familiar with creating true colors, mostly creating several of them over a melt season for the Sermeq Kujalleq Ablation Region. By creating this script, it just makes everything a little easier so you donā€™t have to manually import which .TIFF files you want. Iā€™ve had some experience with python before starting this course so it definitely was a little easier than I expected, and the syntax of python is just leaps and bounds ahead of that stinky language R.Ā 


Introduction – (what each step does)

  1. Create a geodatabase or .gdb ā€” doing this creates a server like storage house your tiff files to make calculations and pull the data back down.Ā 
  2. Create Mosaic Dataset ā€” This creates a dataset to house your images, another important step before using the composite bandā€™s tool.Ā 
  3. Add rasters to Mosaic ā€” Add your images to the datasetĀ 
  4. Composite Bands Tool ā€” From the mosaic dataset, import them to the composite bandā€™s tool, which creates the Truecolor image raster for you.Ā 


What Did I learn? ā€”

I learned a lot from this project, firstly that ERSI software is insanely tedious when it comes to using their programs. I needed to jump through several hoops just to create a geodatabase. The geodatabase is created through ArcServer – everything must be run through the server and you need to have the software installed to even create one.Ā 

I learned to problem solve way better on my own, knowing exactly what to search to find solutions to my problem was a huge success. I genuinely didnā€™t have any problems with this project, nothing that was too halting that I felt like I needed to stop the project or require outside help. I dedicated about 8-10 hours a week to this project and it was mostly spent debugging and finding solutions to my code.Ā 

One issue that came across was at the very beginning of the project. To use the Arcpy library, you cannot have the newest version of python installed. The newest version is 3.10, but arcpy is currently only compatible with 3.7 and below. I felt like this project was a great introduction to the GIS developing world, and I am very glad that I took it. Overall, I am very confident in my work for this course. I believe that this script has significant use for GIS creators and researchers.Ā