Chapter 1 consisted of a lot of similar entry points to GEOG 291 and the book we read for that. I like that at the top of every chapter they provide a list of what is going to be covered. They focused on a lot of definitions with the first part of the chapter which was nice. Web GIS is the combination and GIS (geographic information systems). They then discussed the advantages of using Web GIS, and one of the advantages was that Web GIS is more user friendly and easier to manage than ArcGIS and so far, that is absolutely accurate. They made a point to recognize that GIS is the science of locations: which means that GIS is a science and that GIS has been used for science as an effective tool for making scientific discoveries. I wondered if GIS itself would truly be considered a science? That point seemed interesting to me.
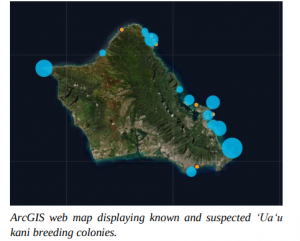
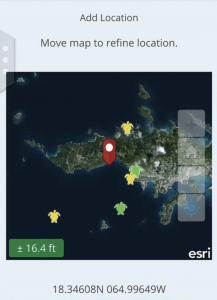
I liked how in Chapter 1 they provided examples of common uses of Web GIS and ArcGIS Online and how those might show up on a map! That was helpful to see laid out. This whole chapter was very interesting and helpful to understand the background of the whole website and how to use it. There seems to be a lot of knowledge and thought that went into creating this platform, and I like how in depth they went into that. The rest of the chapter seemed similar to the training we had to complete for week 1. I liked how the content types were discussed too, which are data, layers, web maps and scenes, tools, and apps. I also liked how the book gave us step-by-step instructions on how to navigate the website and create different maps and layers. I also liked how at the end of the chapter they included some questions and answered them, so now I know how to do those things too; like finding the latitude and longitude. I think after viewing these things so far, I’d love to do my project on birds and their habitats in some way. One of my articles for week 1 was about birds in Hawaii and their breeding grounds, and it might be neat to do something like that.
Chapter 2 started with explaining how smart-mapping and storytelling with GIS works. I learned that feature layers can be used and styled with different web apps on Web ArcGIS. Then there was a confusing table that I had to spend some time looking at and understanding, as I didn’t really know what it was at first. After doing that, I realized that the table was telling us how to create web apps, which was cool! The next step was describing the definitions of each type of feature layer, which was interesting because I did not know there were that many different types. You can also publish each of those different layers to the ESRI geospatial cloud. I did have to look up what exactly “geospatial cloud” meant, but it is essentially combining GIS with cloud computing. There are also different types of smart-mapping, which I think I can use in my project. I liked the look of the heat map as compared to density! The codes were a little confusing, but seem similar to R which I am comfortable with.
I liked how in the second half of Chapter 2 they talked about “storytelling” and the ease of using Web GIS. It seems like the authors of this book know that people don’t appreciate complicated things, and they made it easy to understand and comprehend. It was emphasized that a Map + a Narrative + Multimedia = A Story. This was a cool way to visualize things, and I liked how it was made similar to crafting a story in writing. There are sidecars and slideshow maps, along with geocoding and ways to create a story that you want. They went into examples of how to make these layers using CSV files which I found helpful. The tutorials are so similar to GEOG 291 that they went by quickly and were easy to understand. I thought it was cool how they included information on how to insert and create images over a map! And again they included some questions and answers at the end, which I read through and I felt like that helped as well. After reading Chapters 1 and 2, I do think I’d like to do something with birds and their breeding grounds in certain areas.