Chapter 1
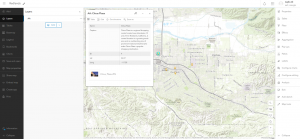
- This chapter introduces basic concepts and workflows of web gis and the esri geospatial cloud. Beginning with an overview of web gis and lists the technical evolutions in web gis and explains its content types, hosted feature layers, app types, and user types in web gis. Then going onto demonstrate the workflow to build web gis apps using the attachment viewer instant app template.
- Starting with publishing a hosted feature layer from a csv file and adding attachmetns; to adding a field to the layer and editting the attributes; then creating a web map; and finishing with creating an instant web app using a template.

Chapter 2
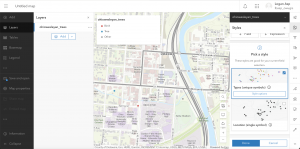
- web layers are important because they are the building blocks of web apps which are important because they are the faces of web gis. Stories being more popular. Continuing the discussion of feature layers and web apps particularly arc gis webmaps. This chapter introduces feature layers and the various ways you may style them using smart mapping and discussing living atlas of the world. as well as further exploring storytelling using gis.
- Tutorial- starting with creating a feature layer using geocoding, then configuring layer style using smart mapping, proceeding to configure layer popups using gis arcade, then adding images and charts to layer popups, finishing up with creating a story and working with swipe blocks and express maps.
